close: $100.22
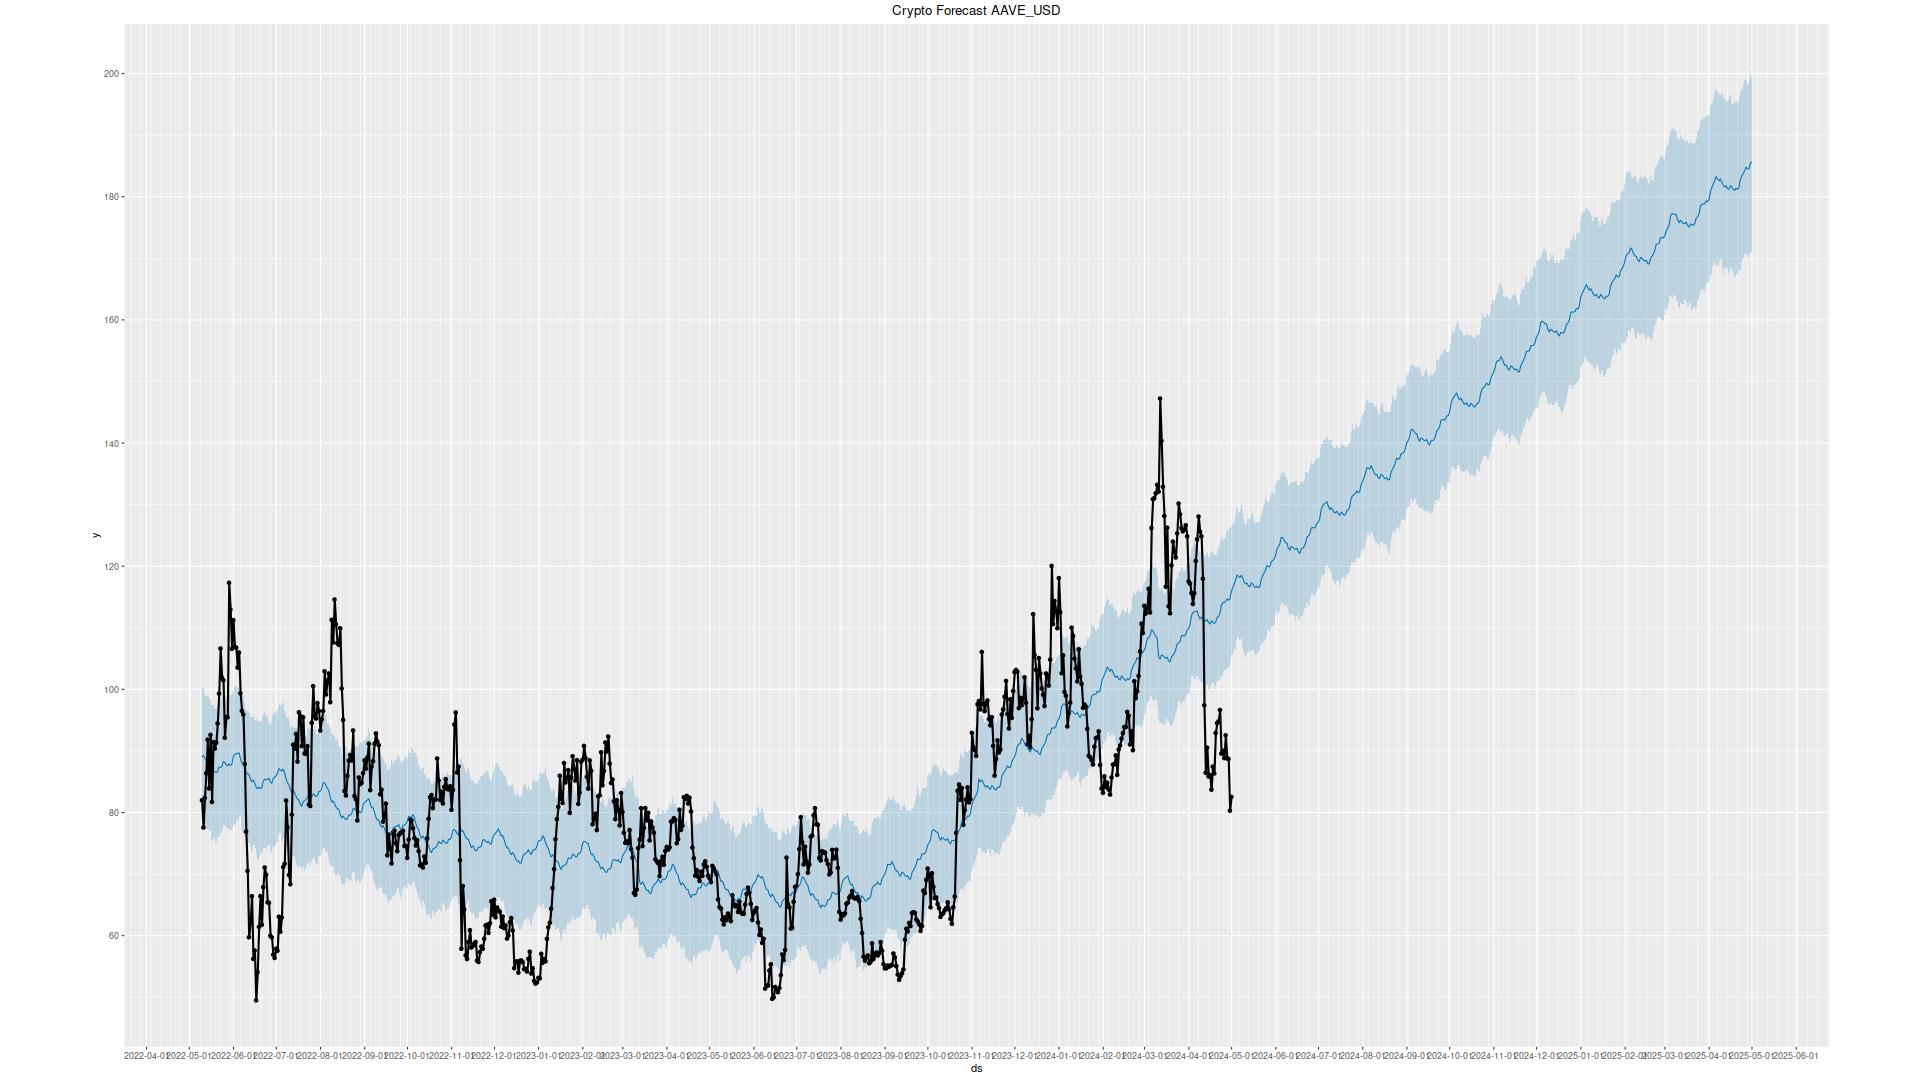
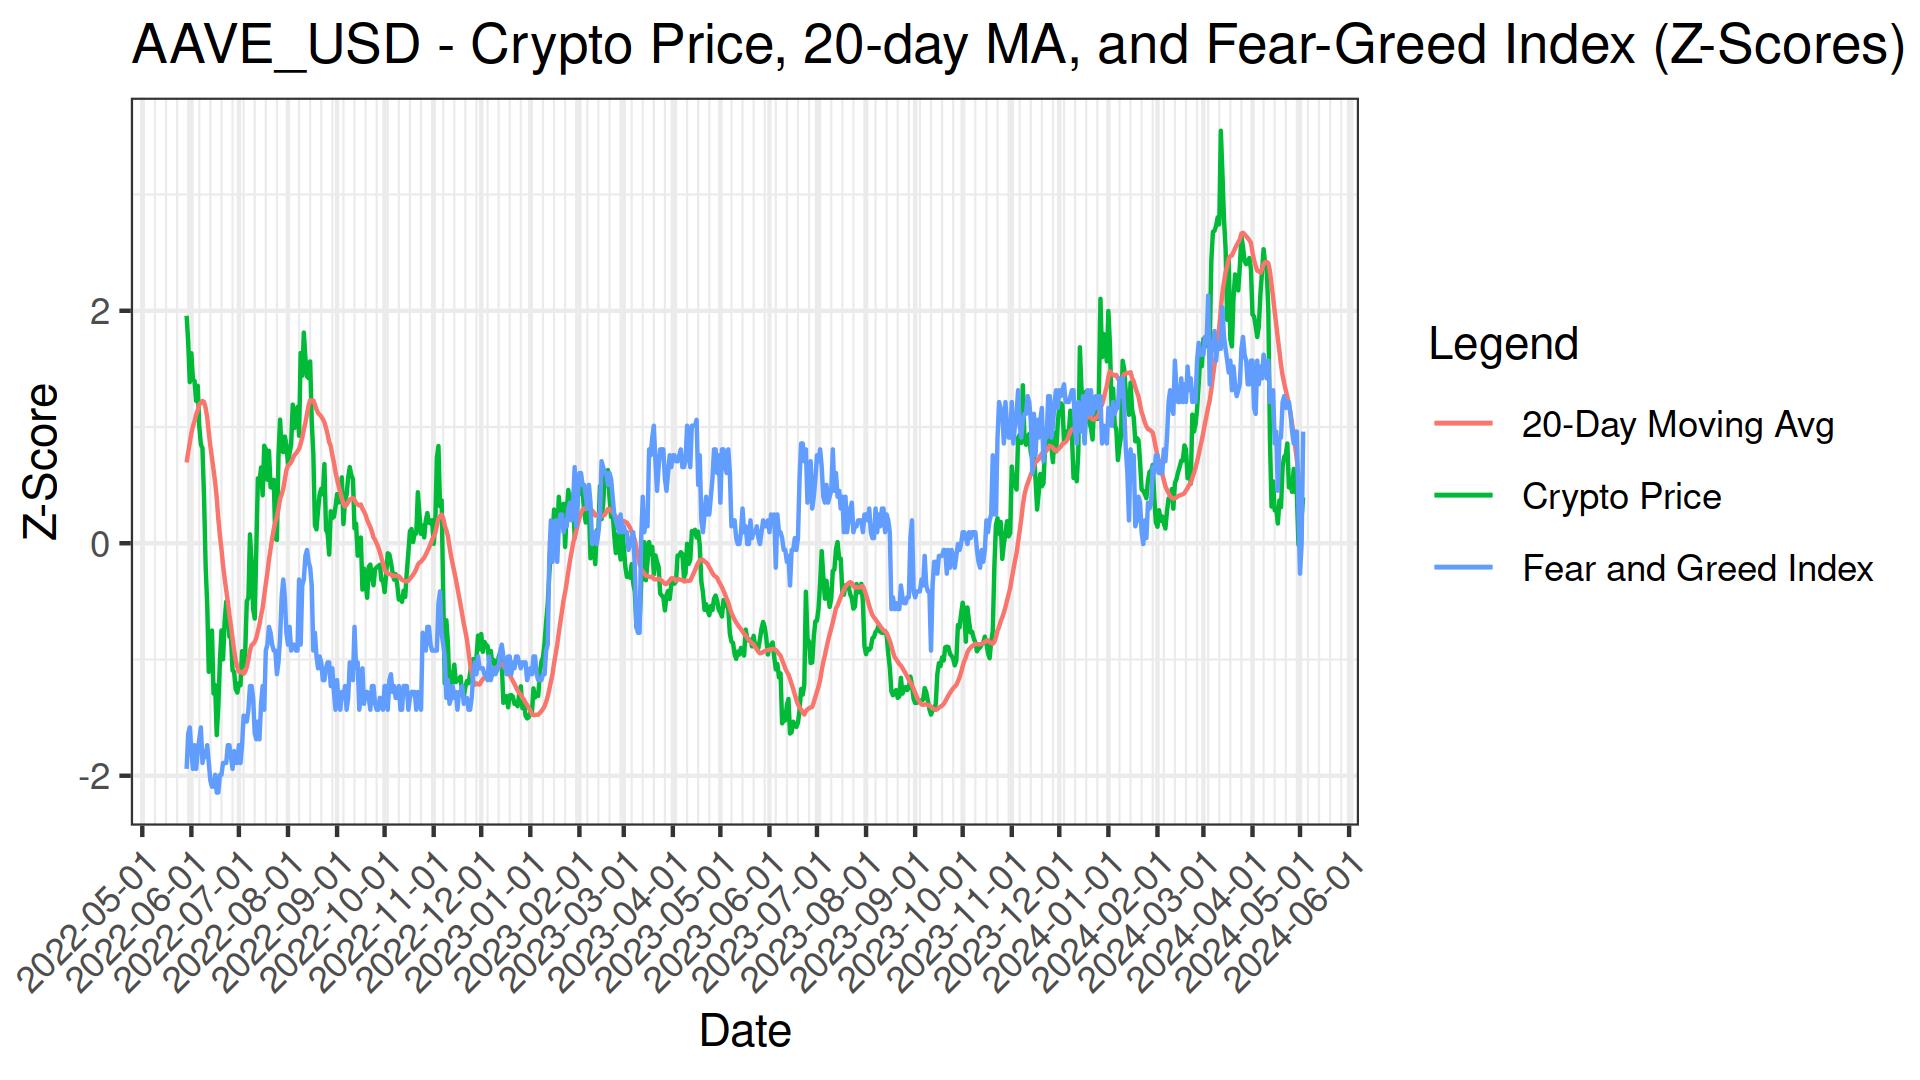
pearsons cor(100-days): 0.2696
| Return Value | Short MA | Long MA | Buy Date | Sell Date | Latest Action | Sharpe Ratio | Drawdown |
|---|---|---|---|---|---|---|---|
| 222.75% | 11 | 107 | 2024-07-17 | 2024-04-17 | 2.24 | -3.30% | |
| 208.97% | 11 | 106 | 2024-07-17 | 2024-04-17 | 2.07 | -3.30% | |
| 199.70% | 10 | 54 | 2024-07-16 | 2024-07-04 | 2.01 | -5.97% | |
| 195.74% | 10 | 50 | 2024-07-16 | 2024-06-14 | 1.82 | -5.53% | |
| 194.44% | 10 | 52 | 2024-07-16 | 2024-06-14 | 1.71 | -4.94% | |
| 191.20% | 16 | 129 | 2024-07-25 | 2024-06-09 | 1.67 | -4.99% | |
| 189.39% | 10 | 53 | 2024-07-16 | 2024-07-04 | 1.66 | -6.28% |
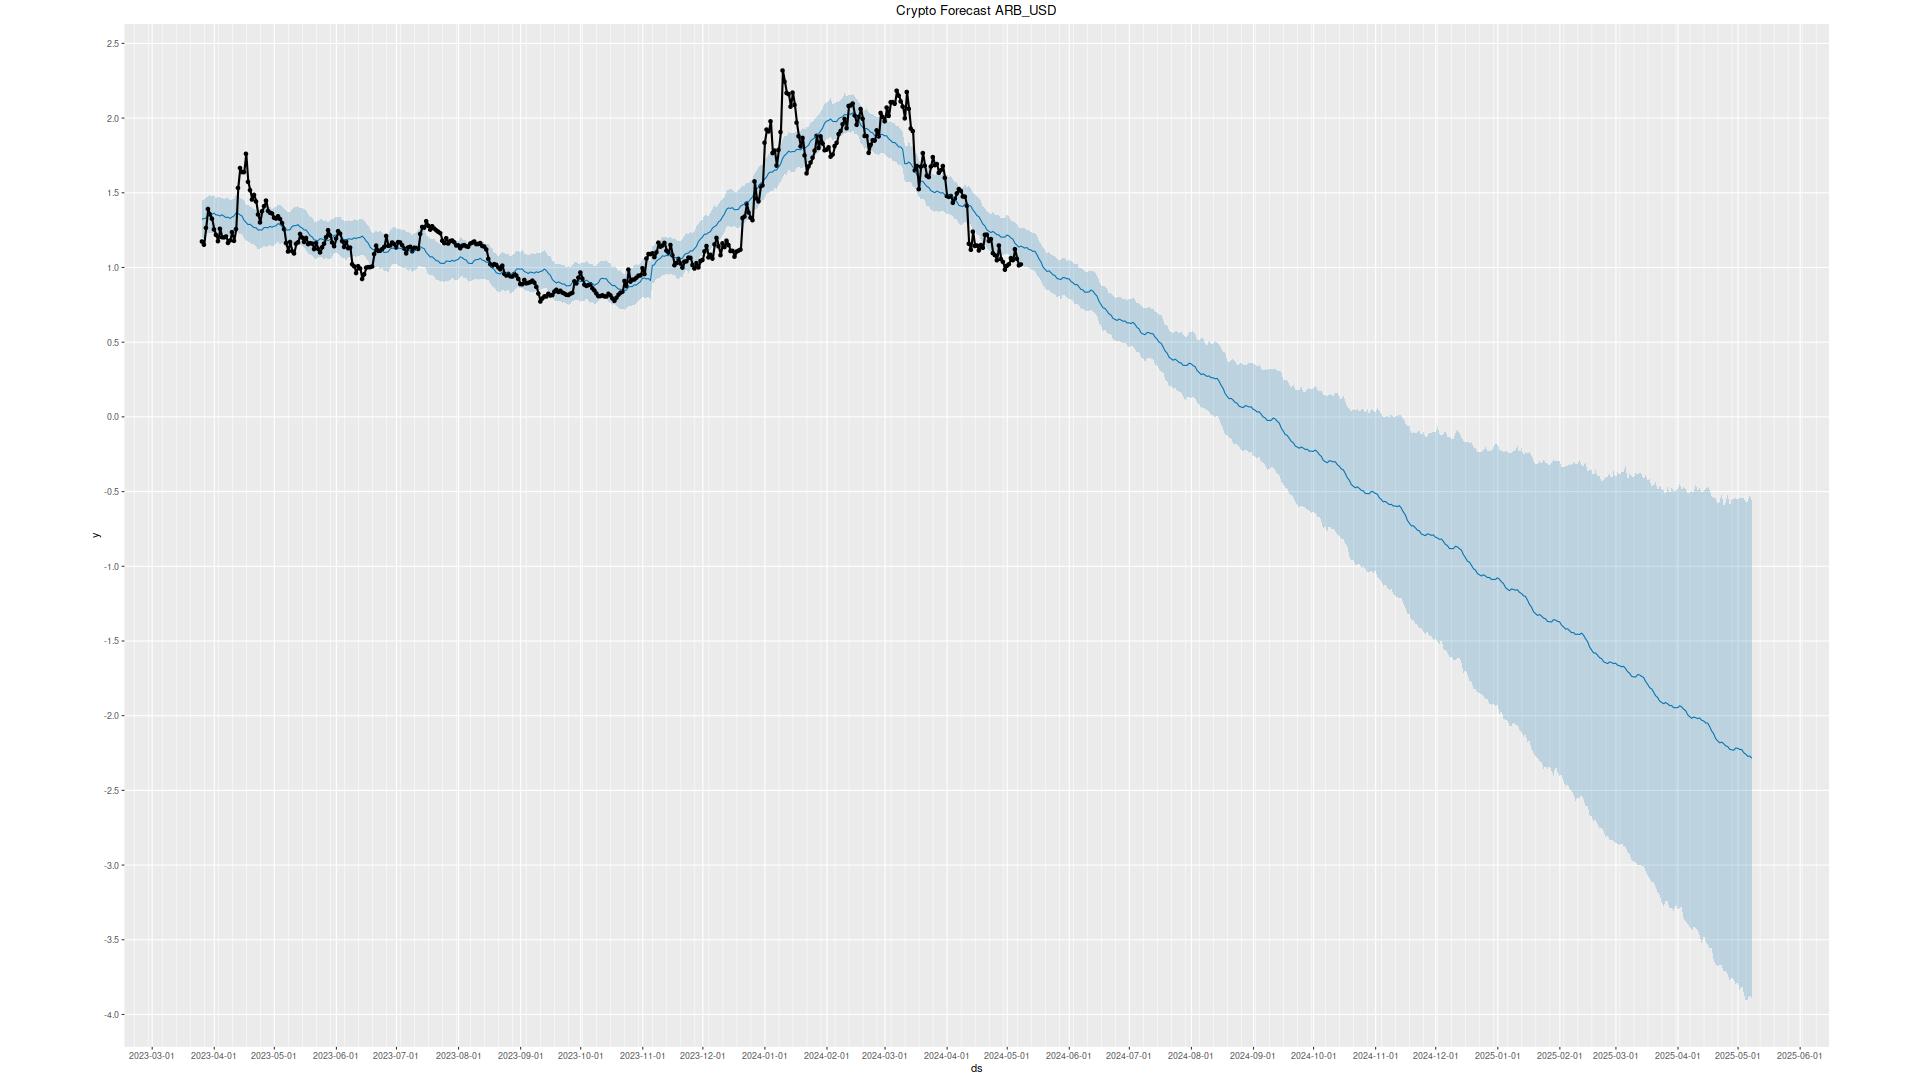
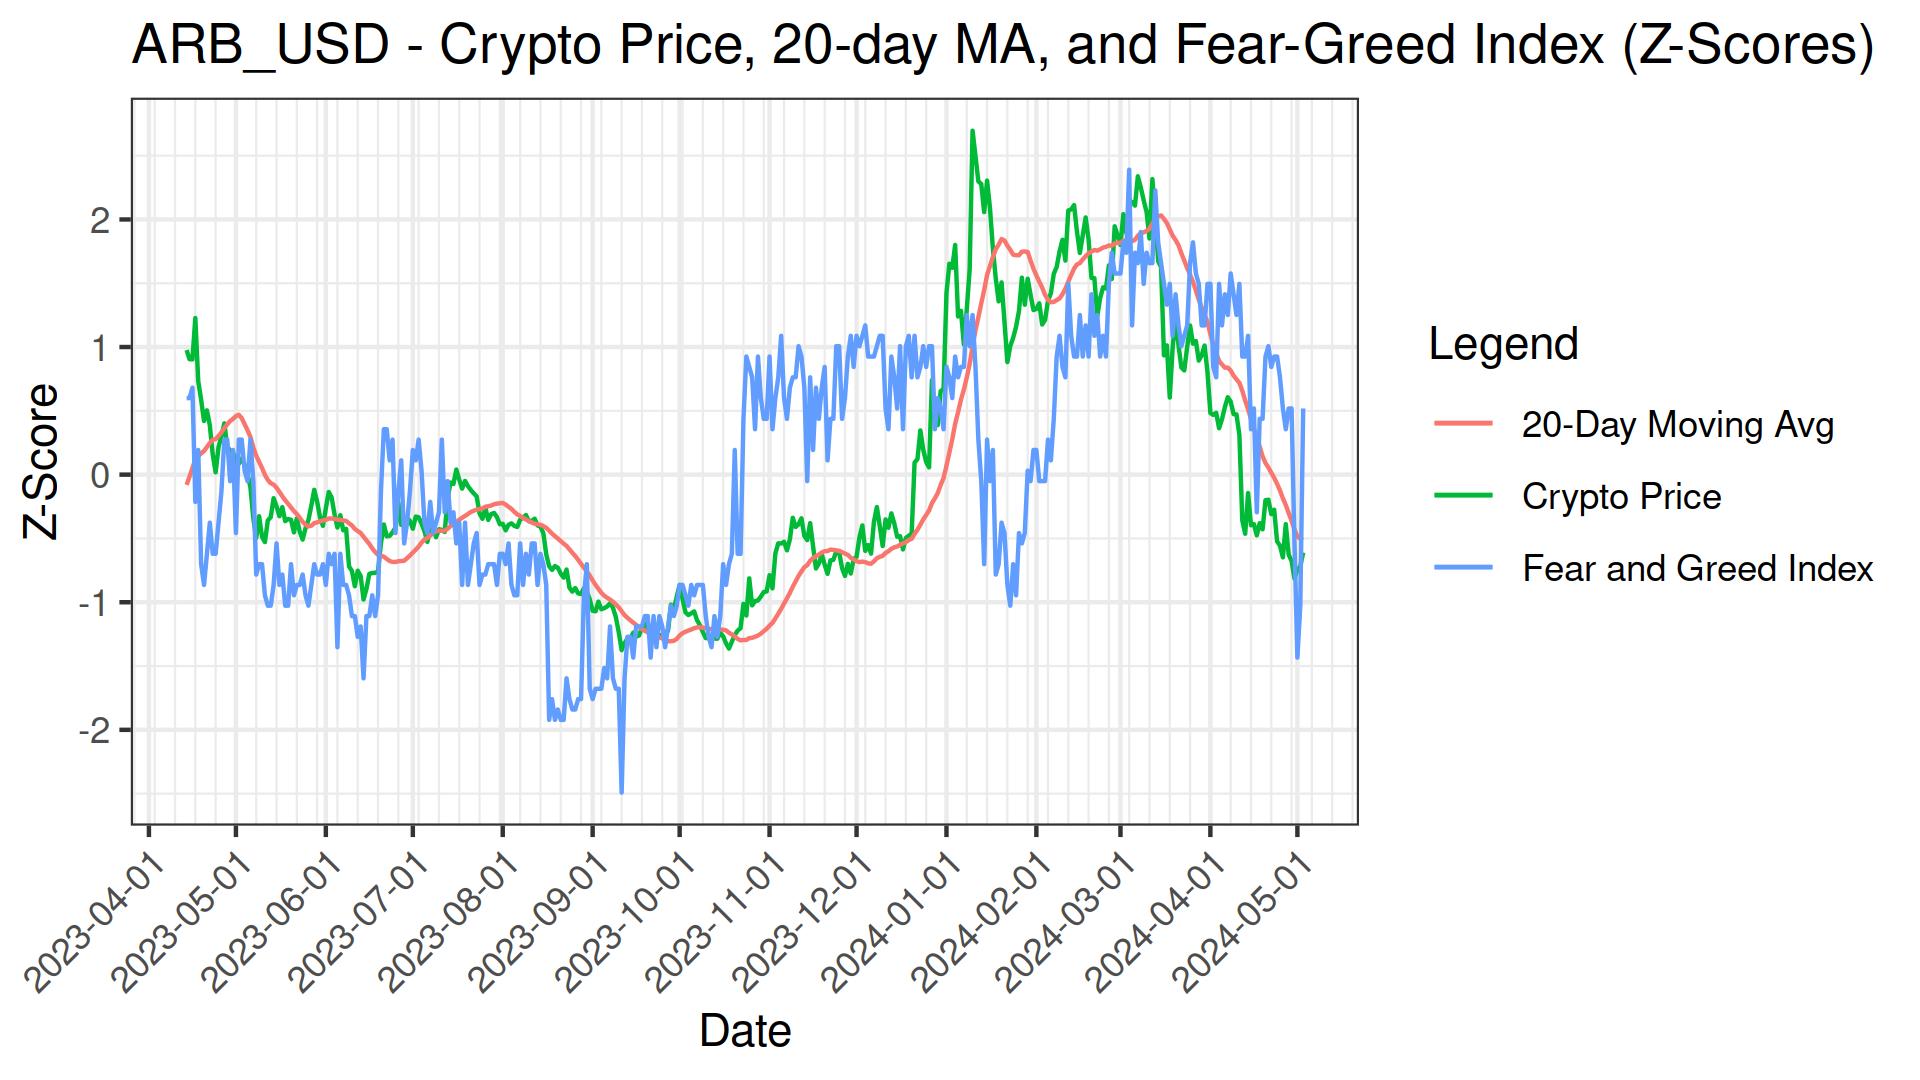
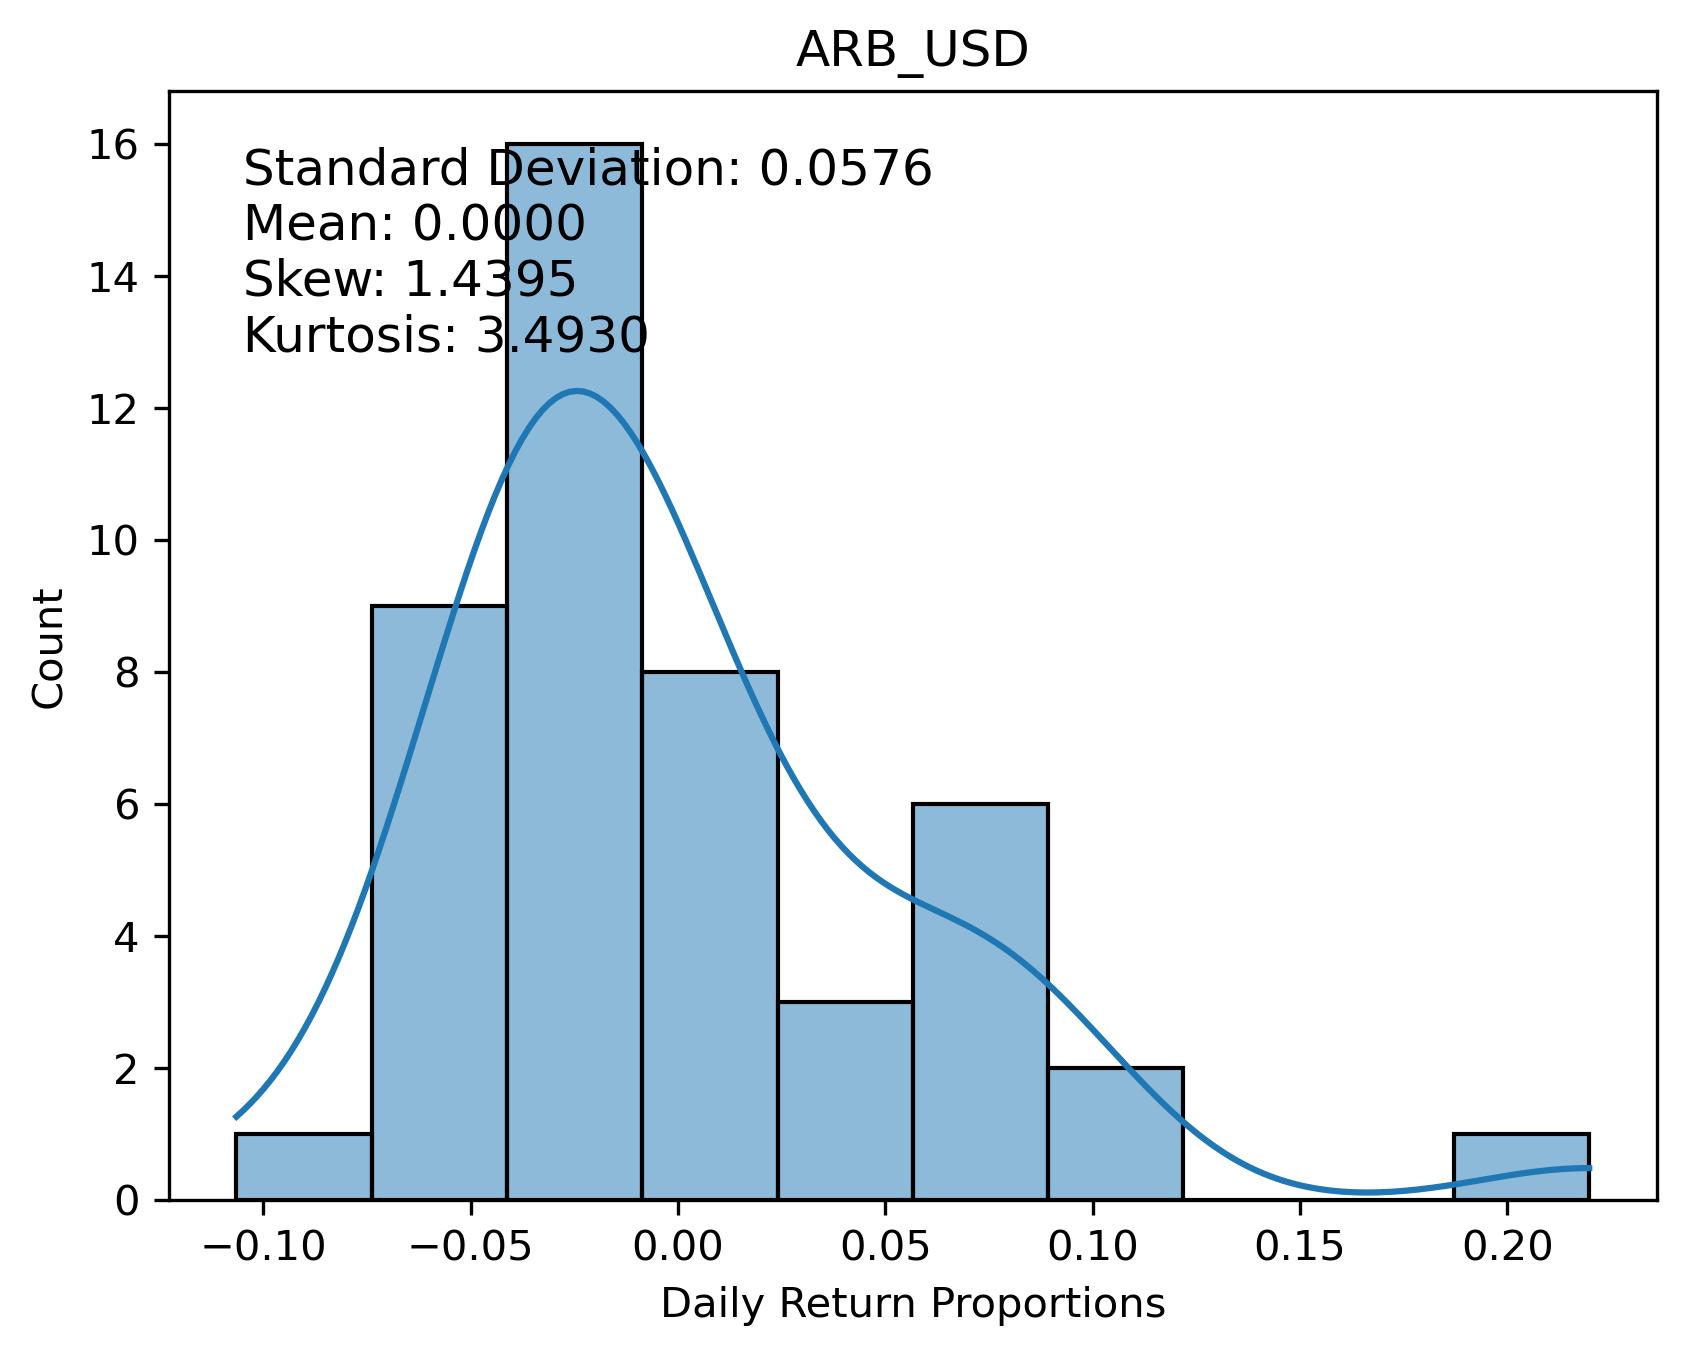
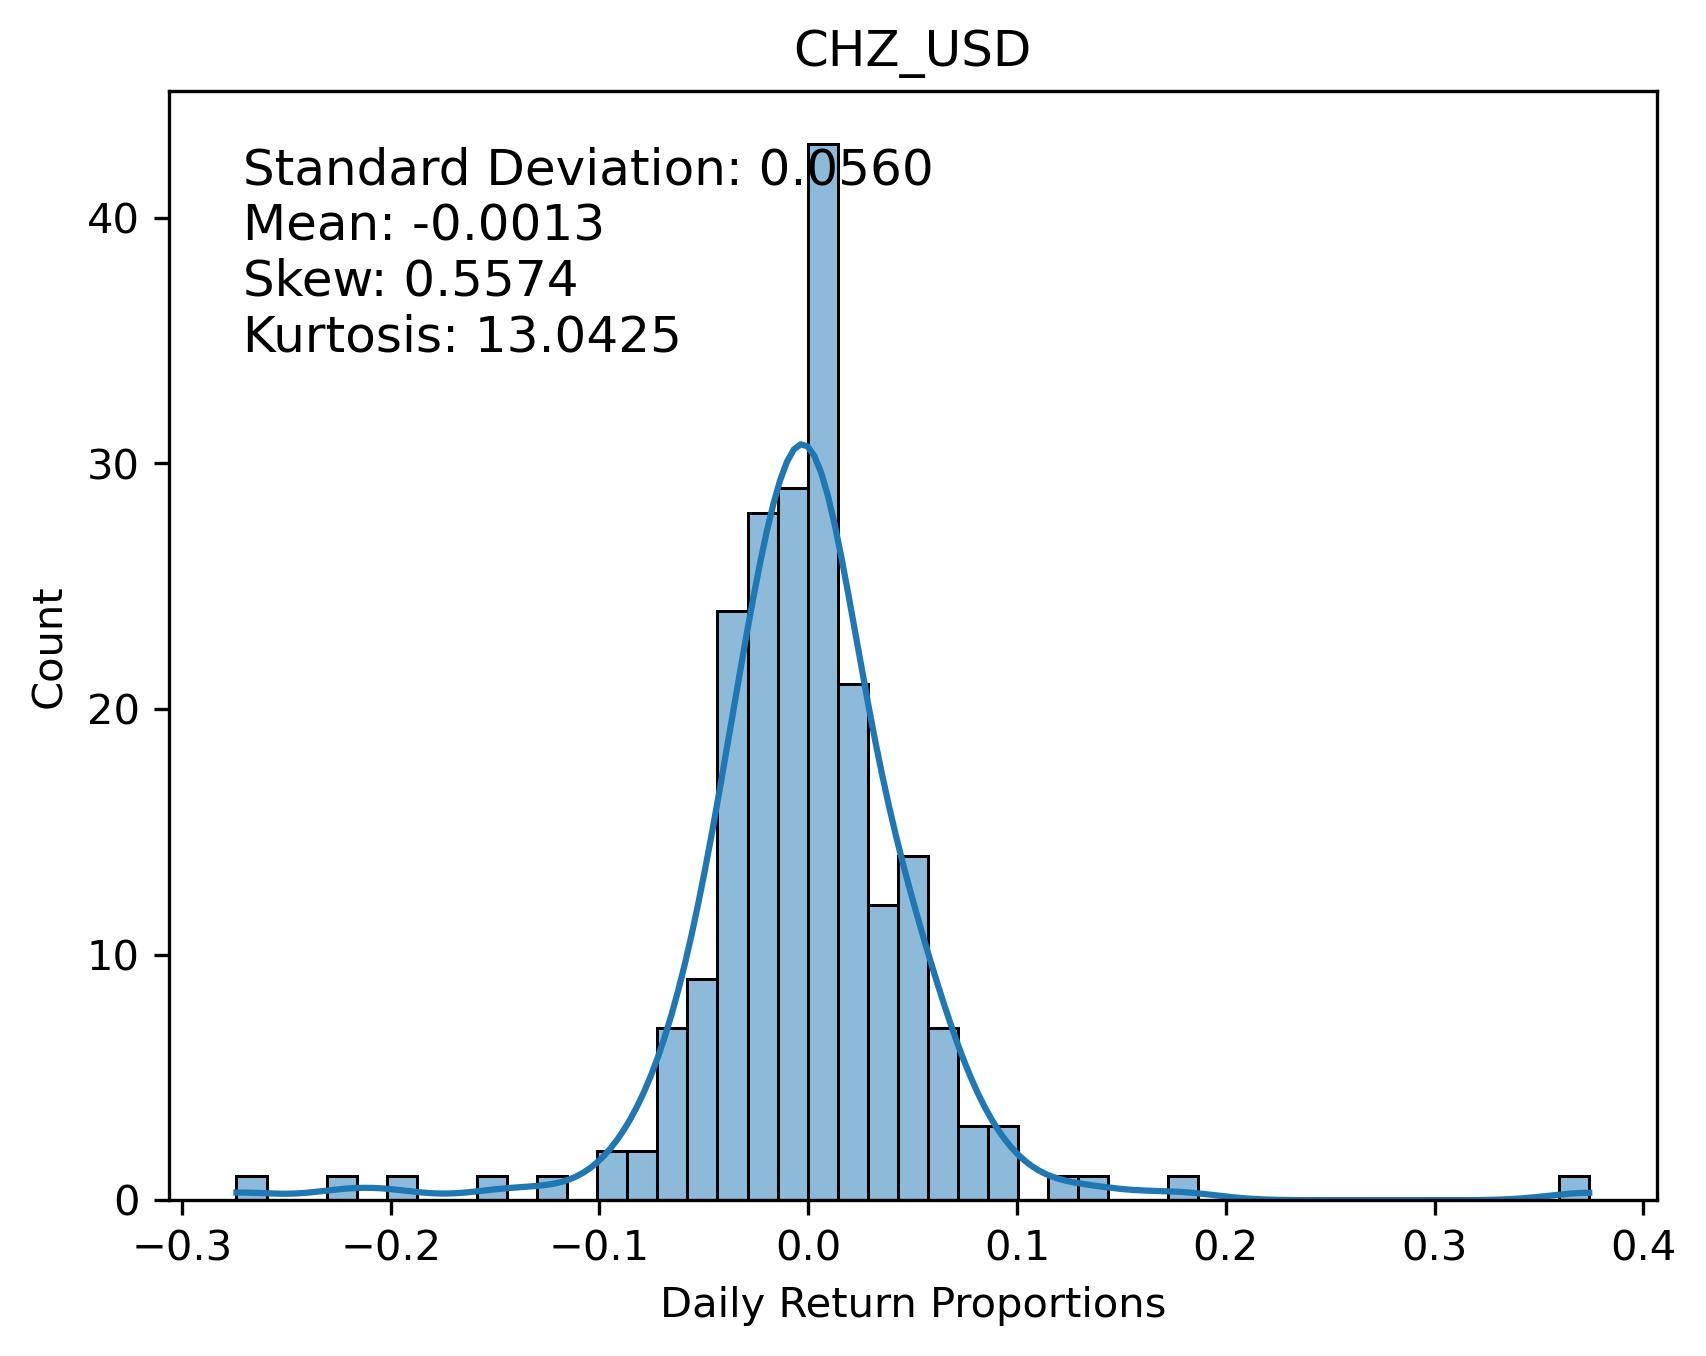
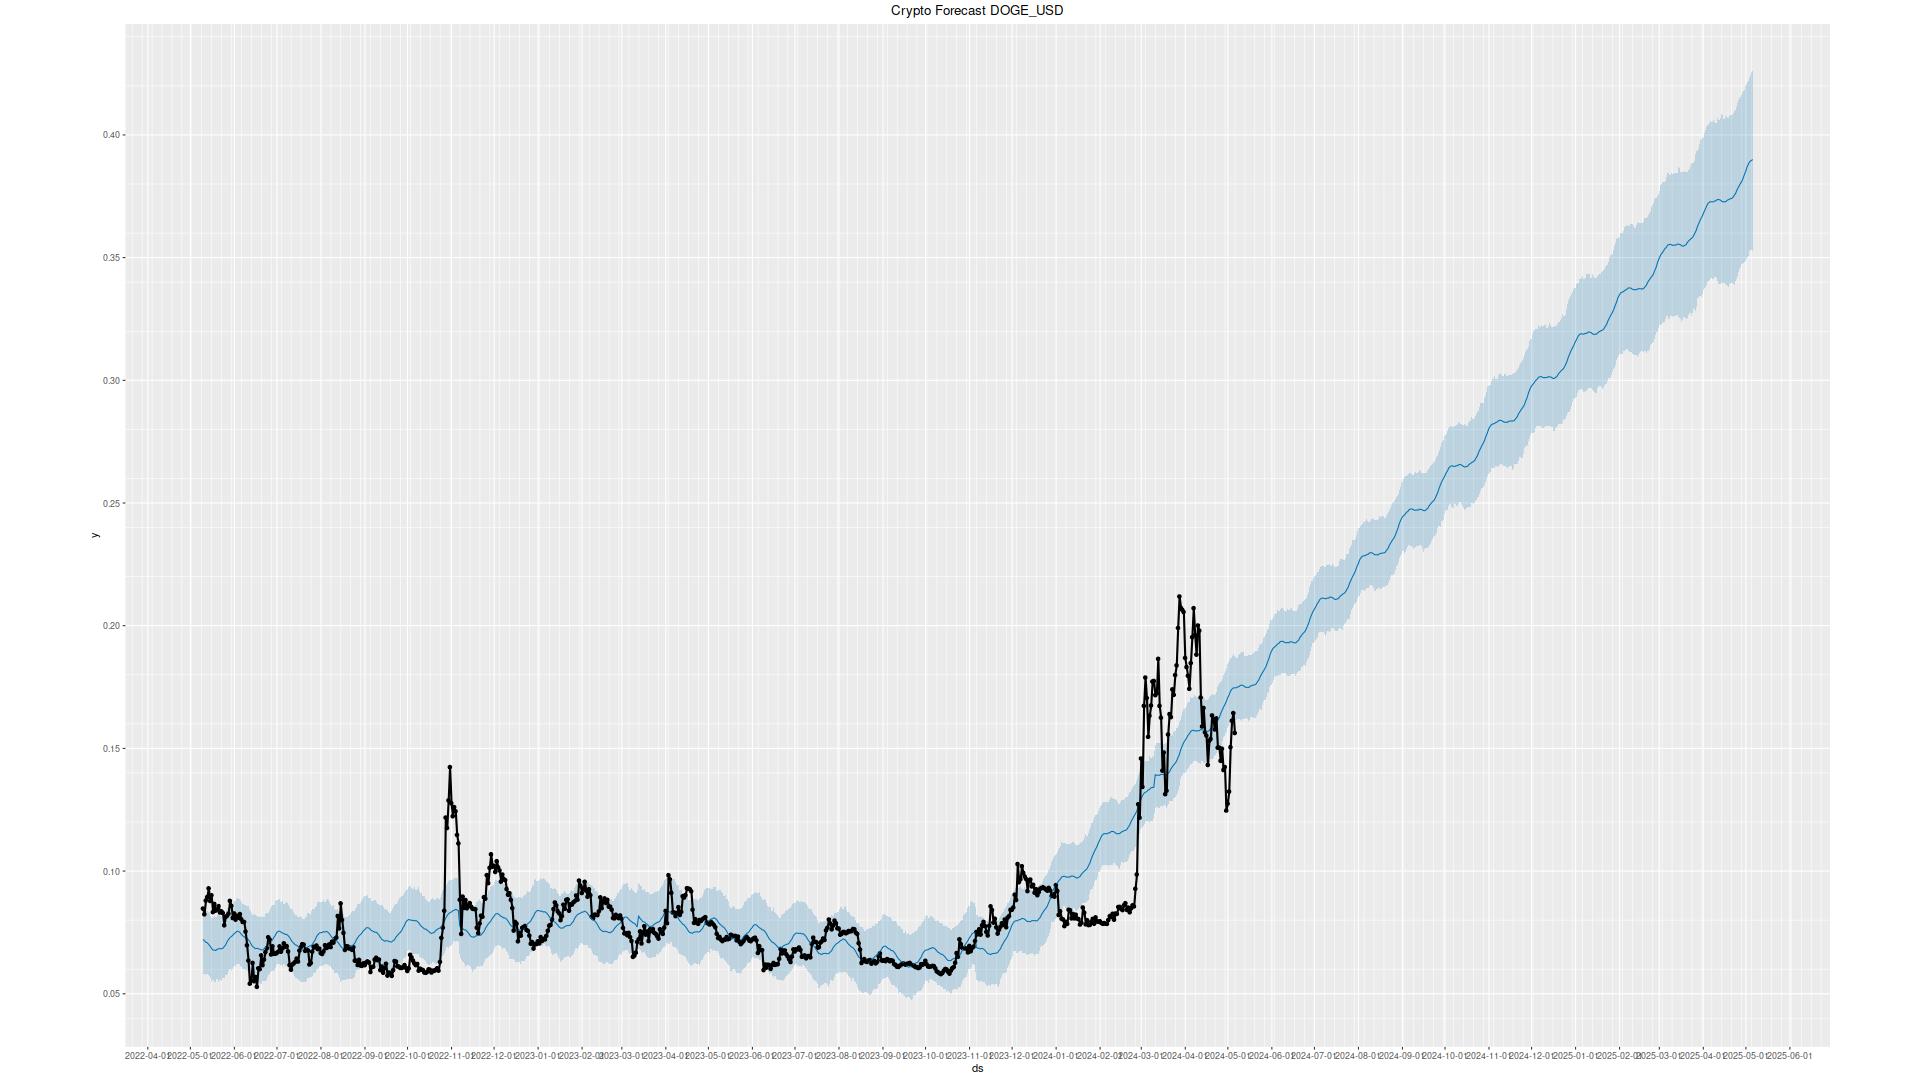
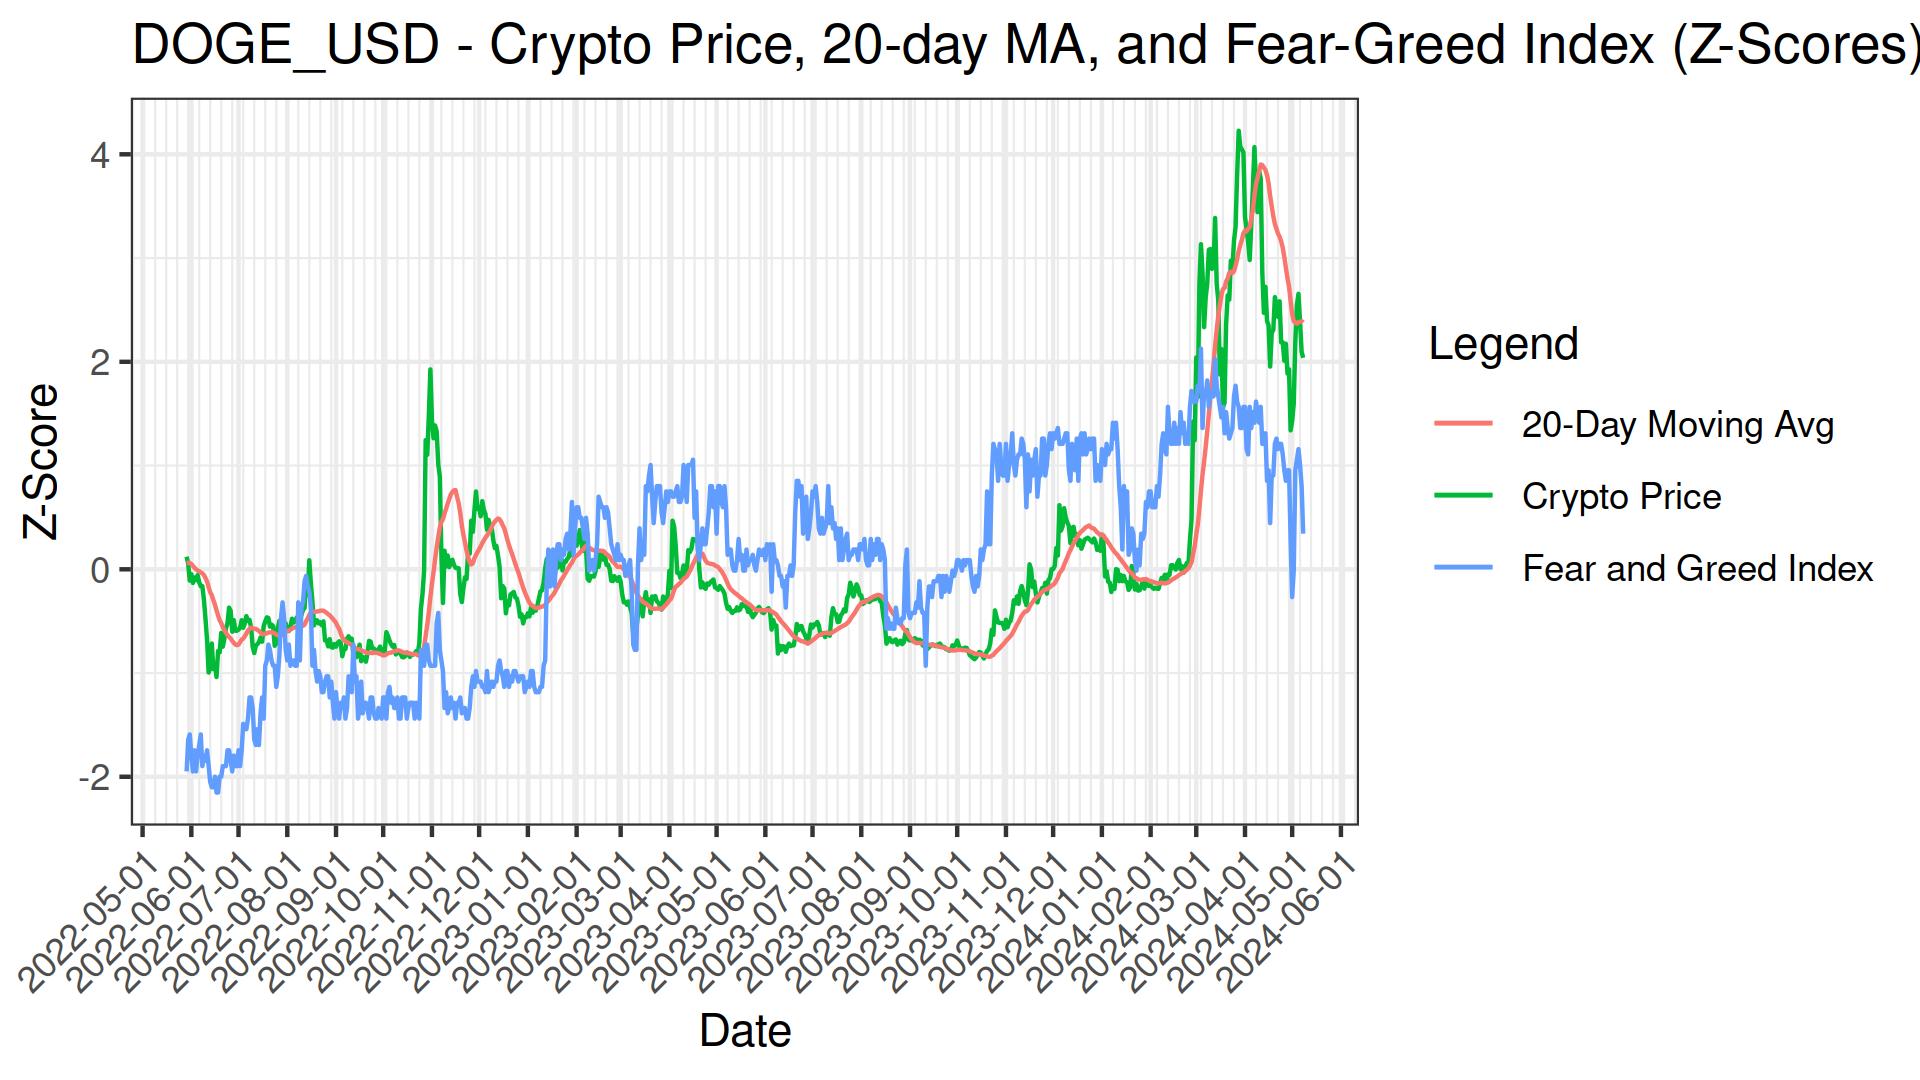
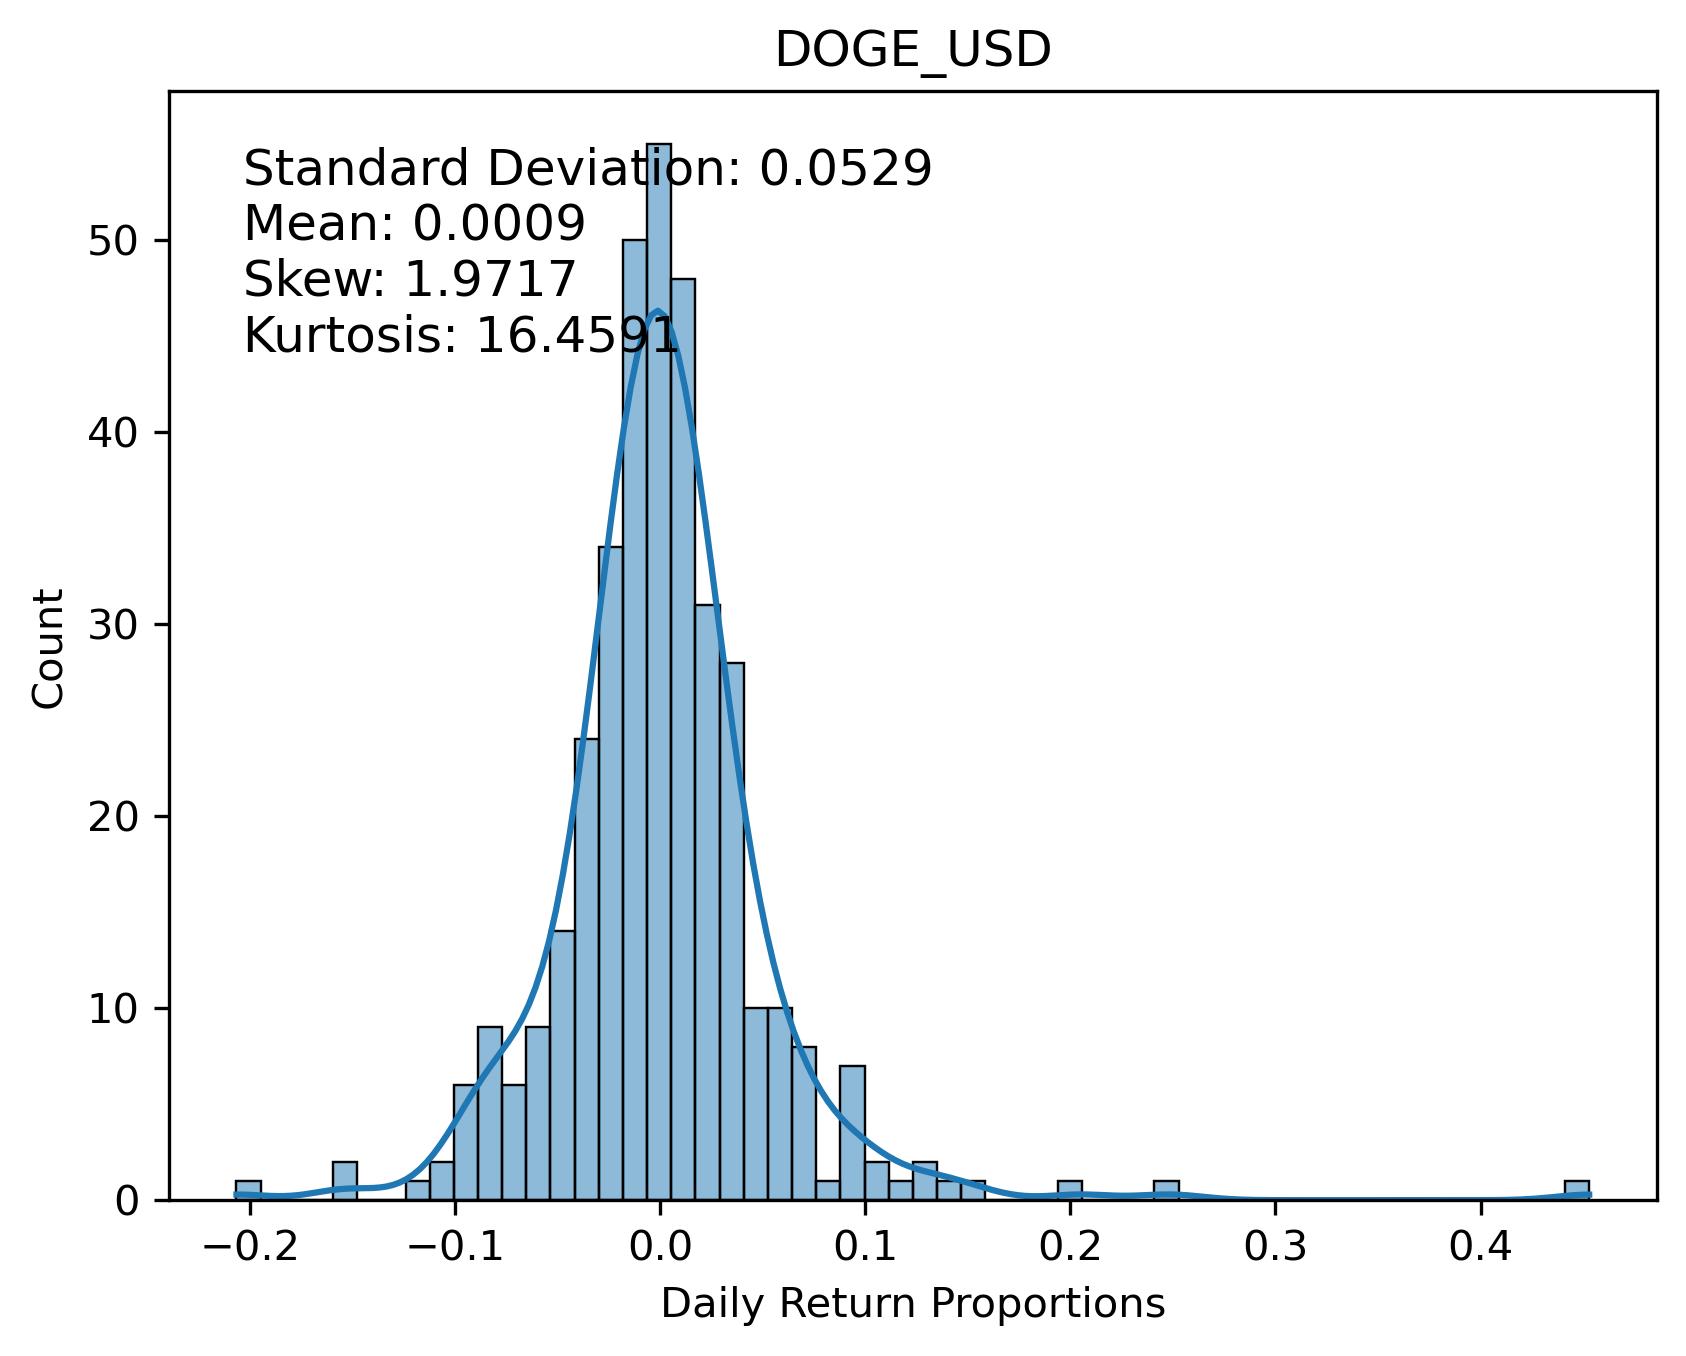
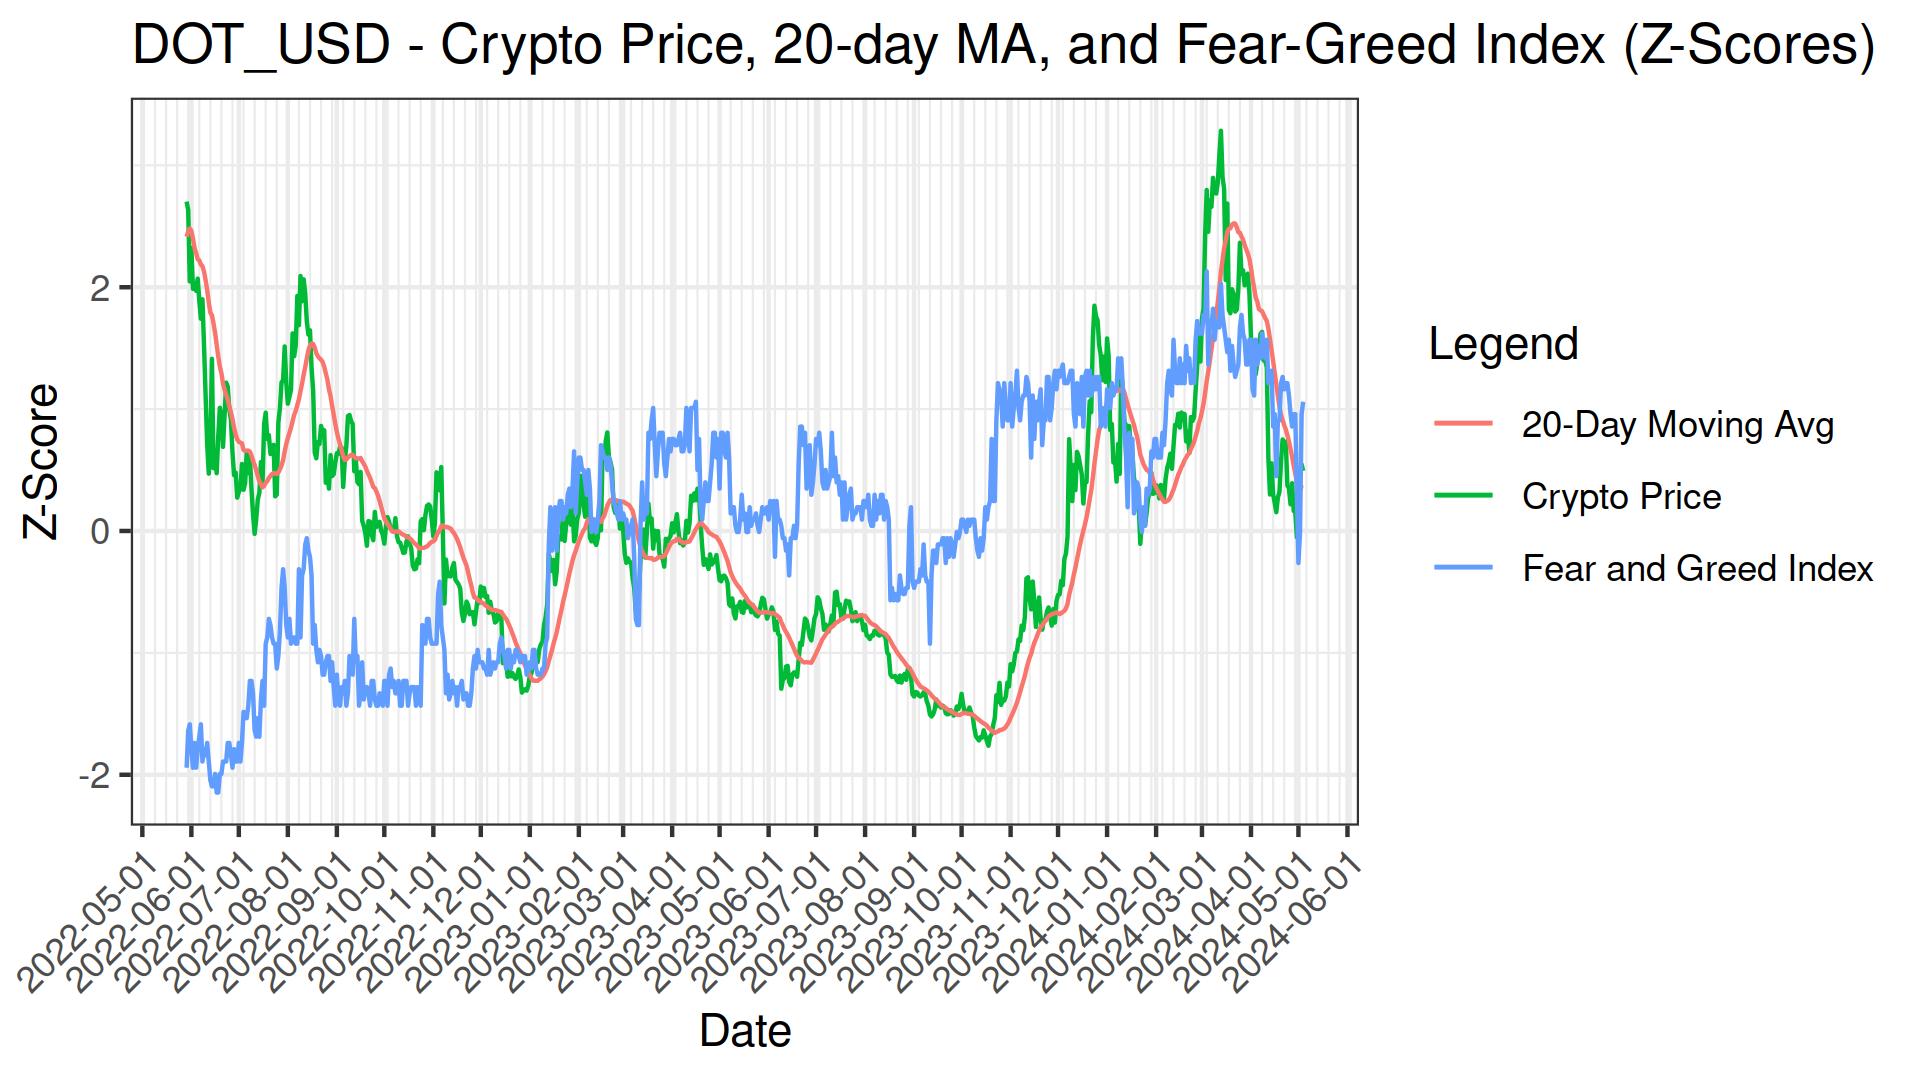
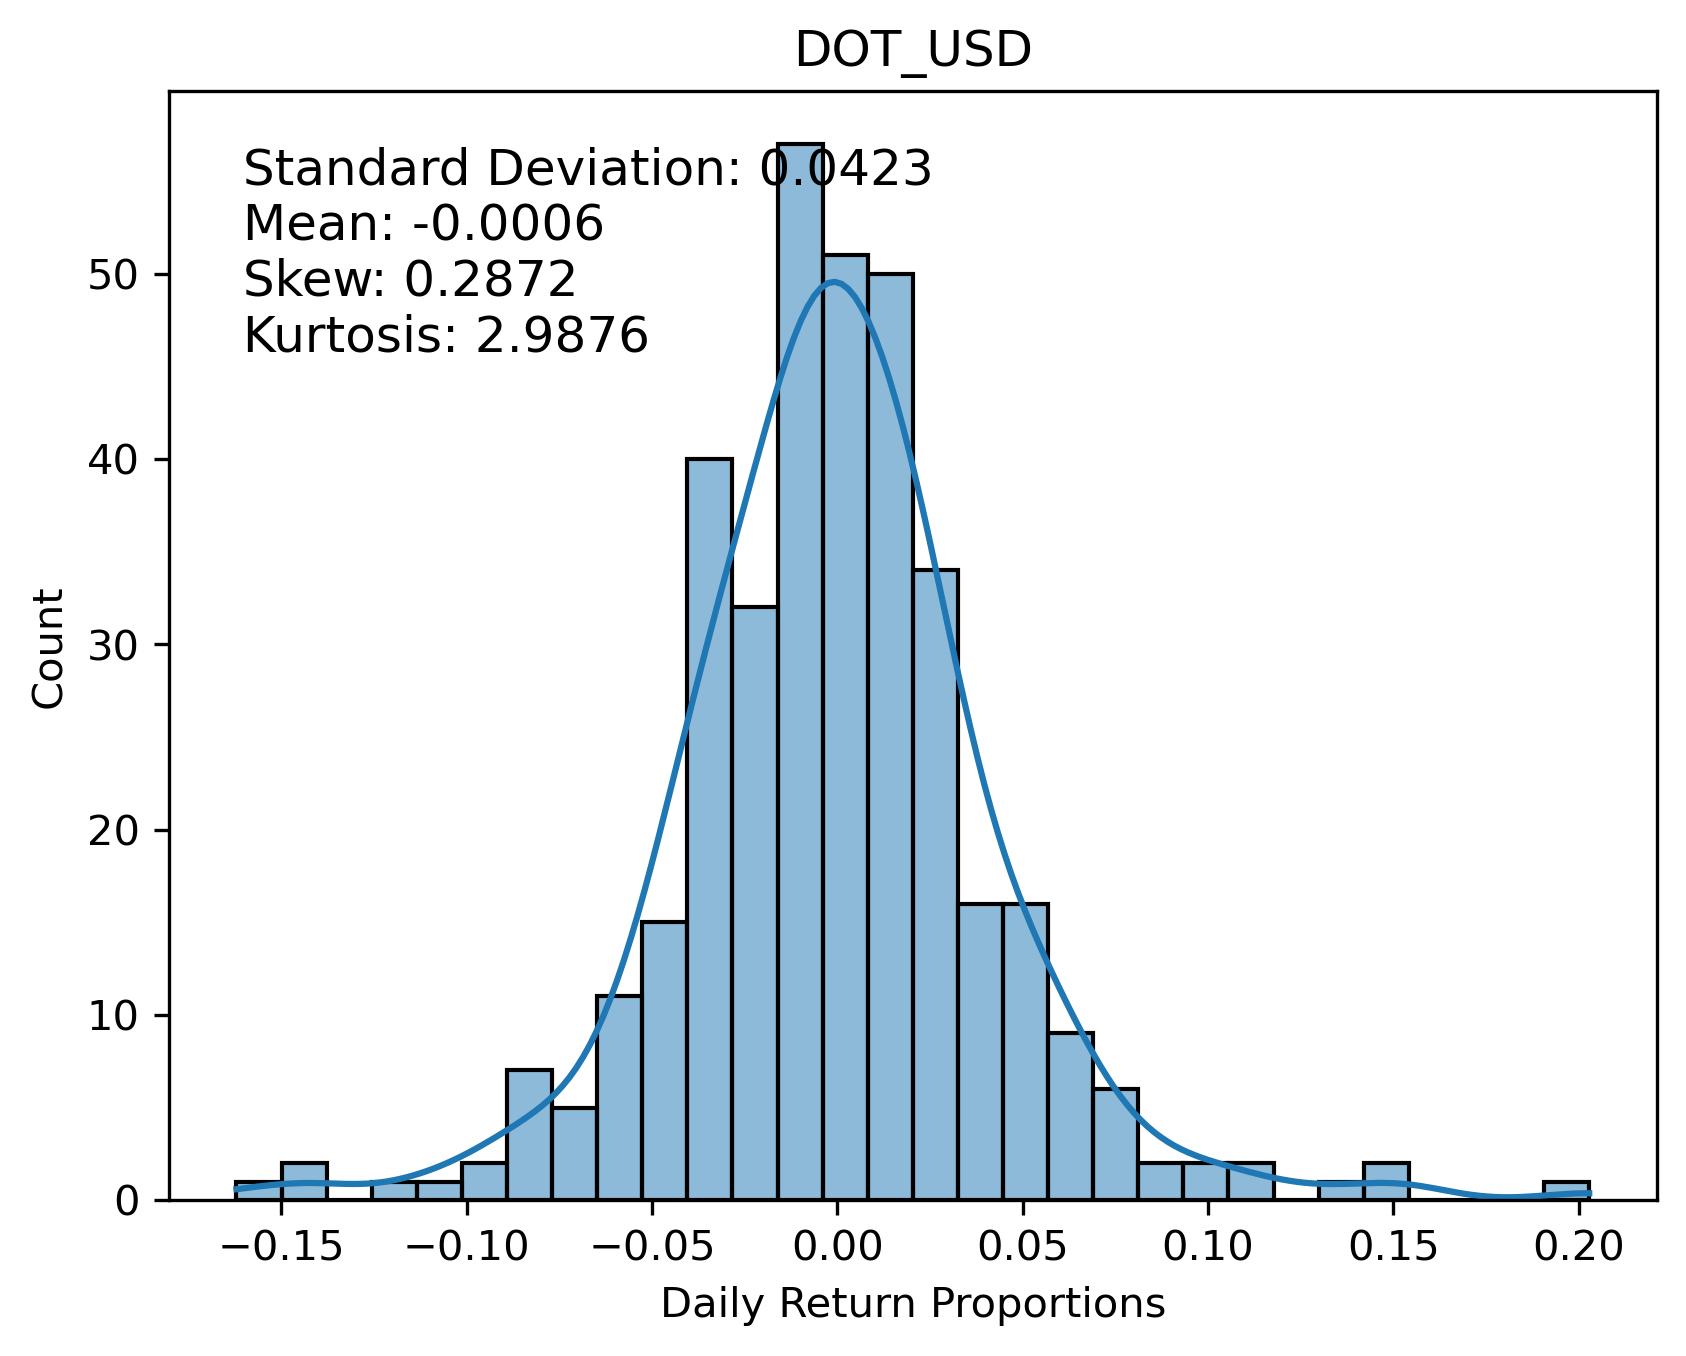
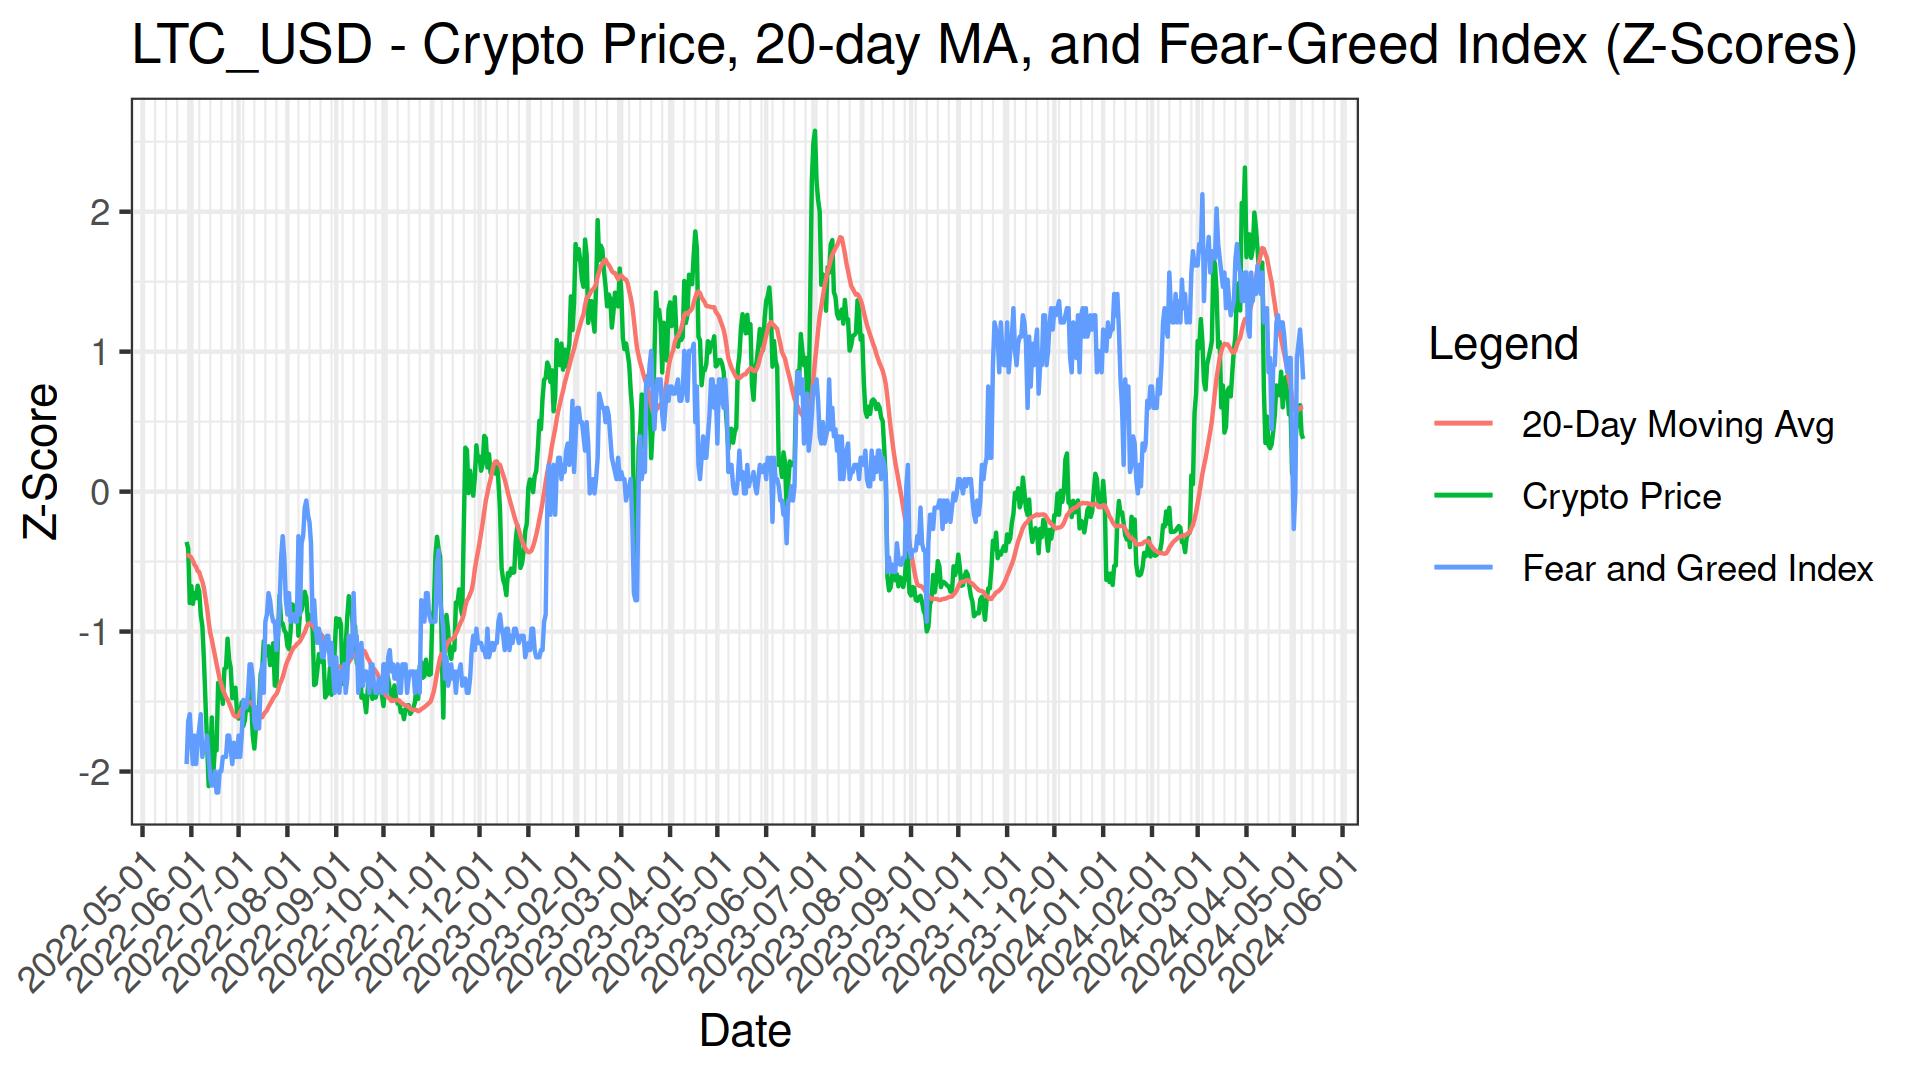
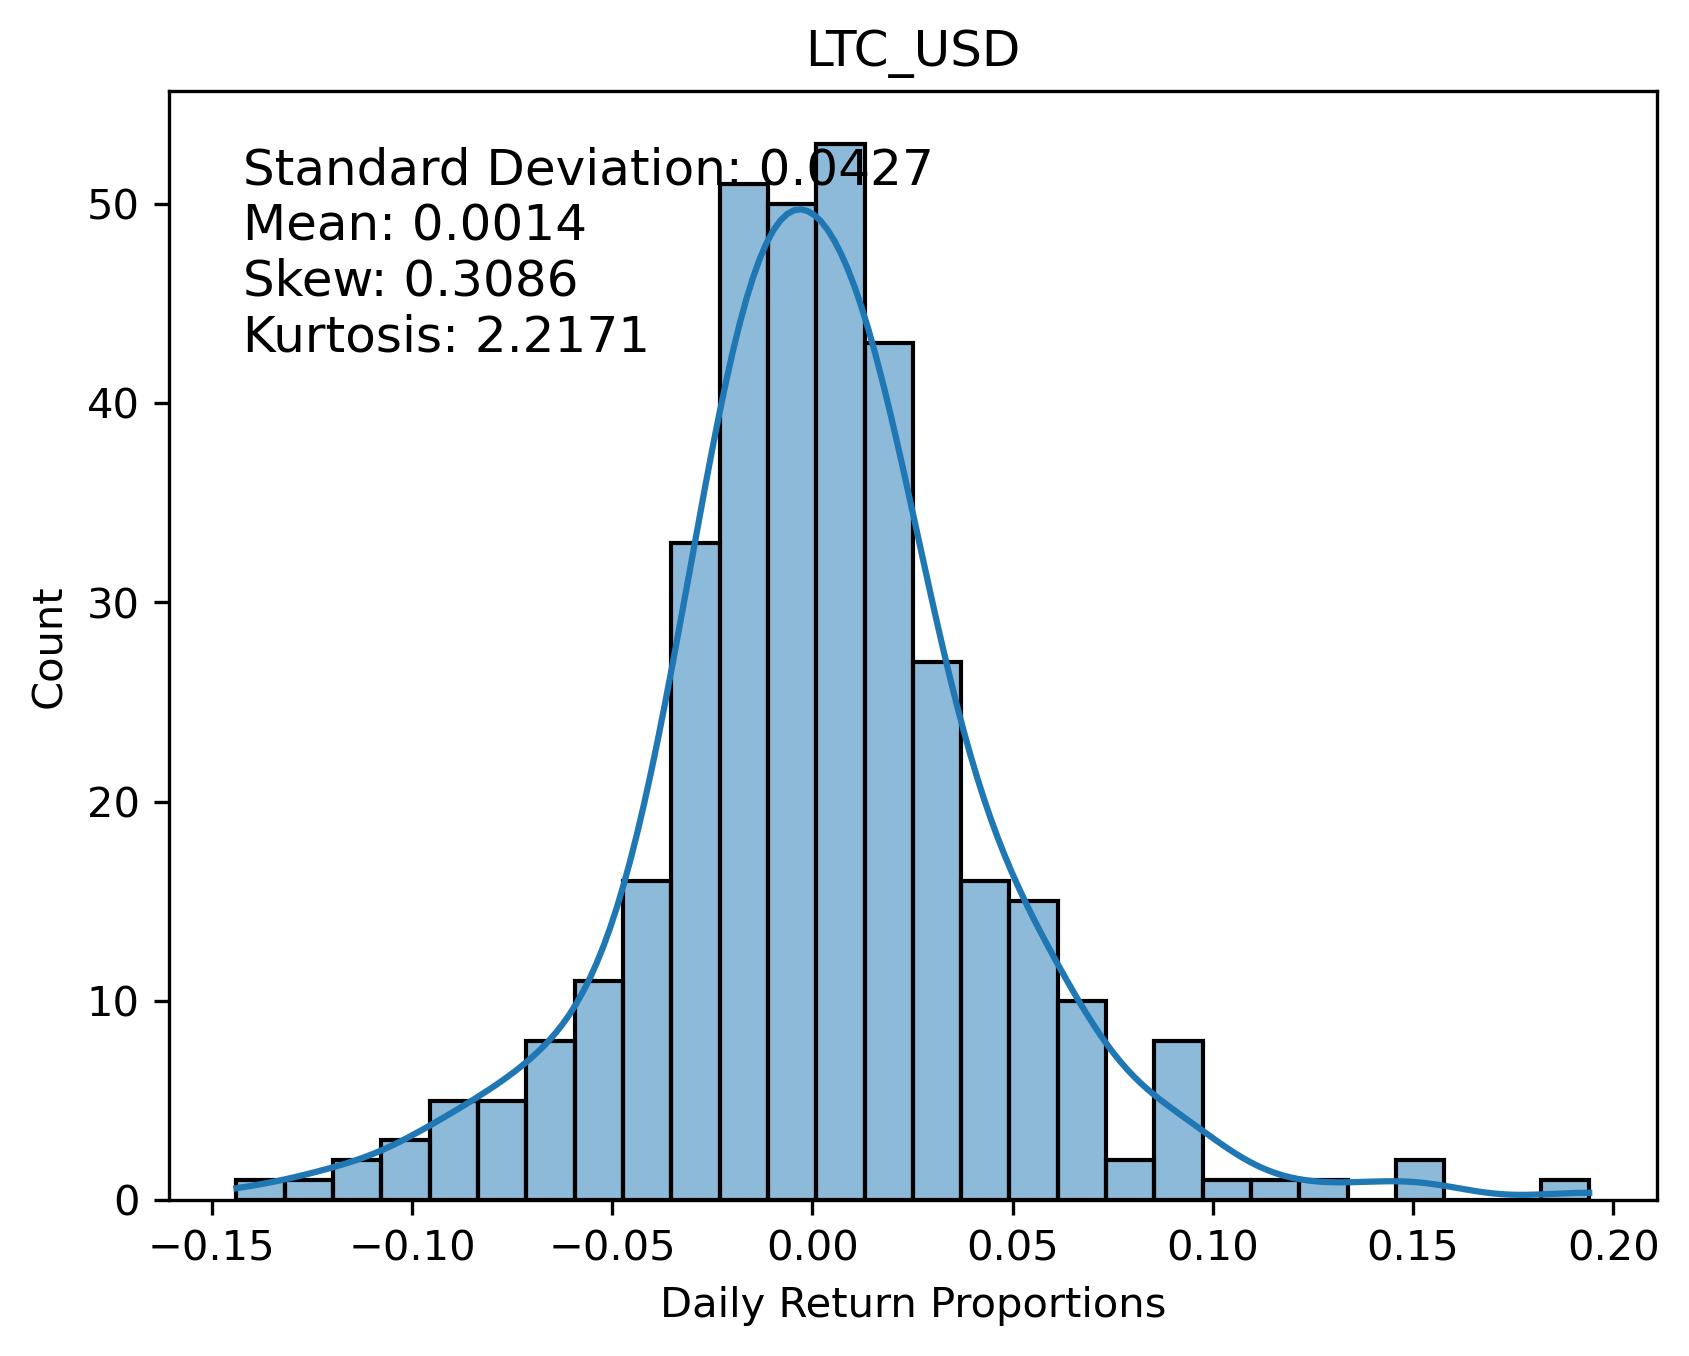
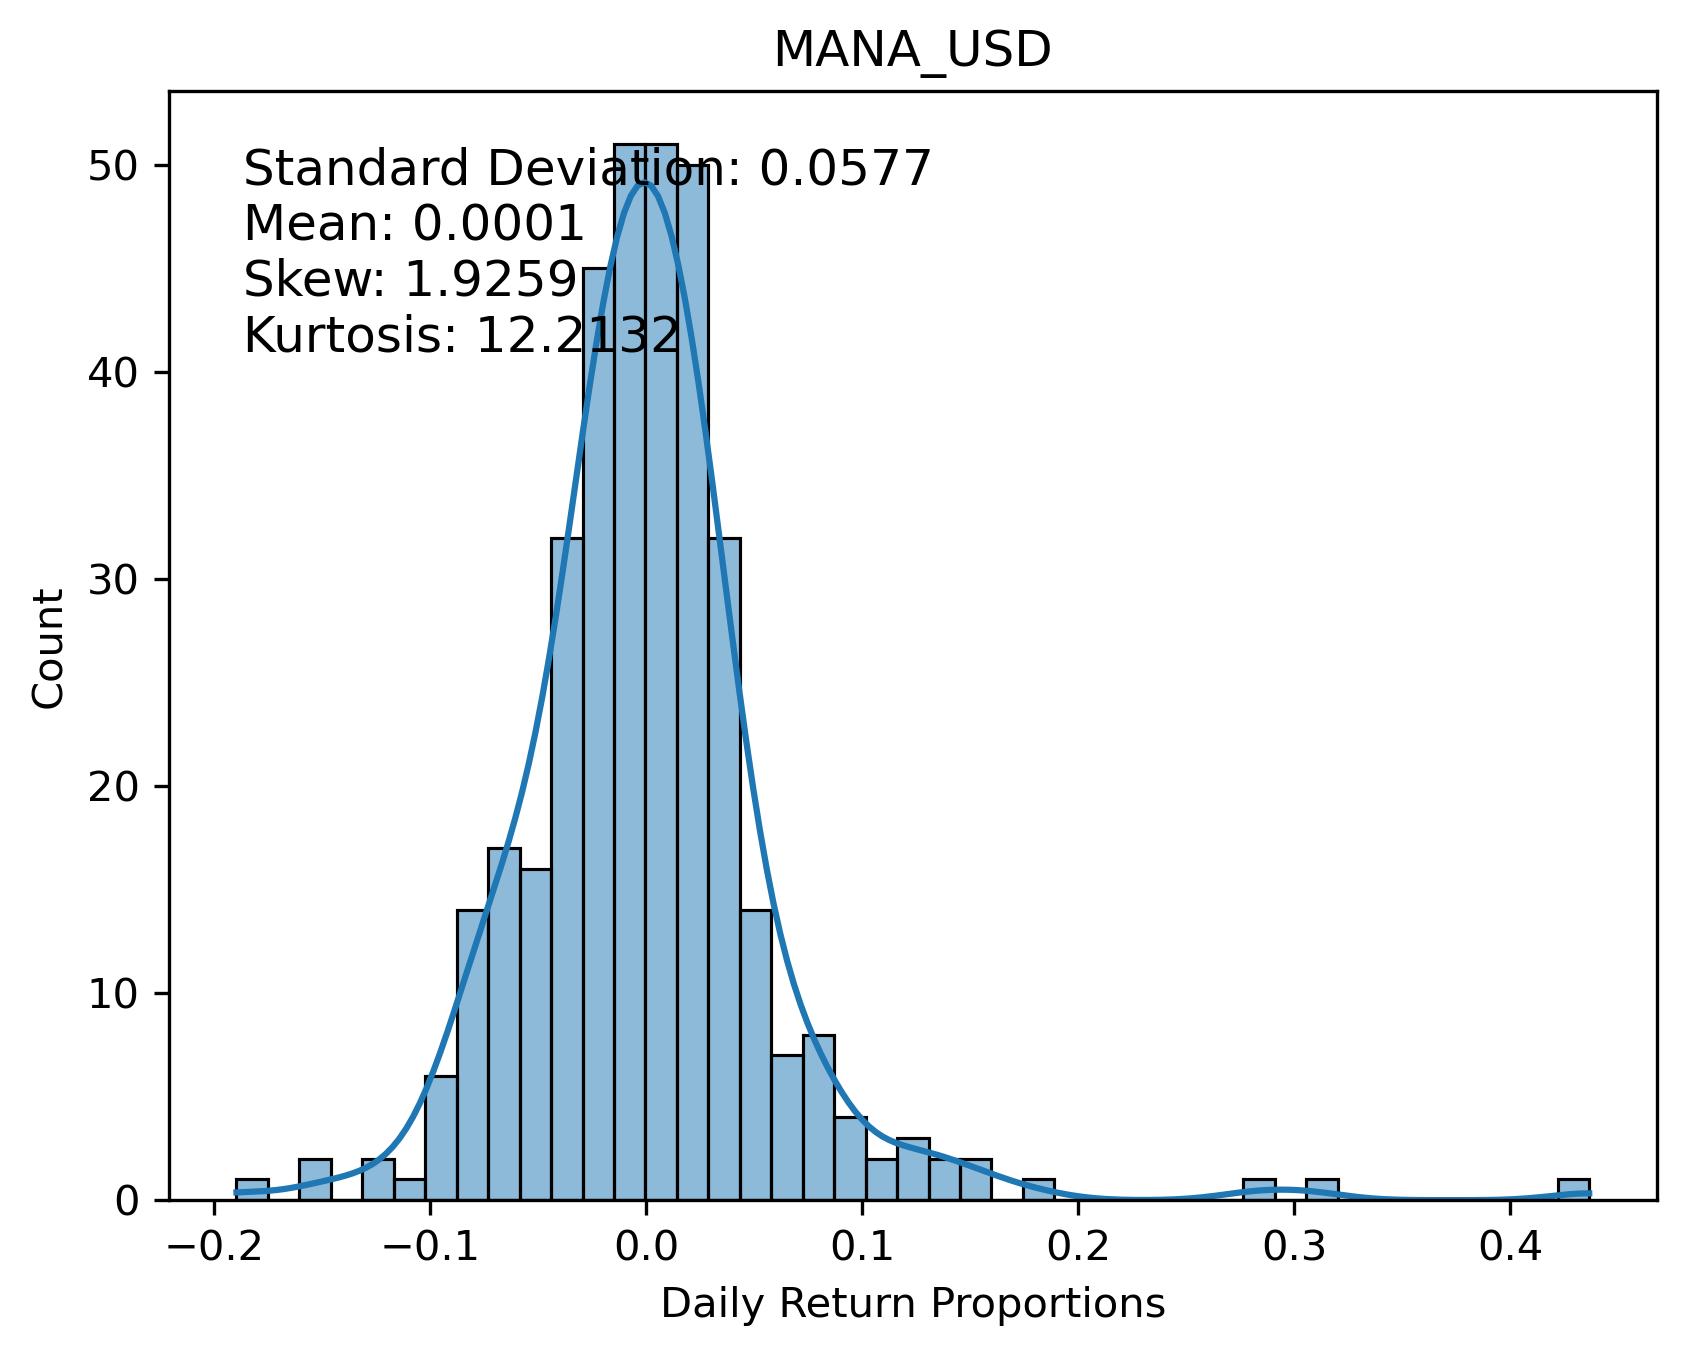
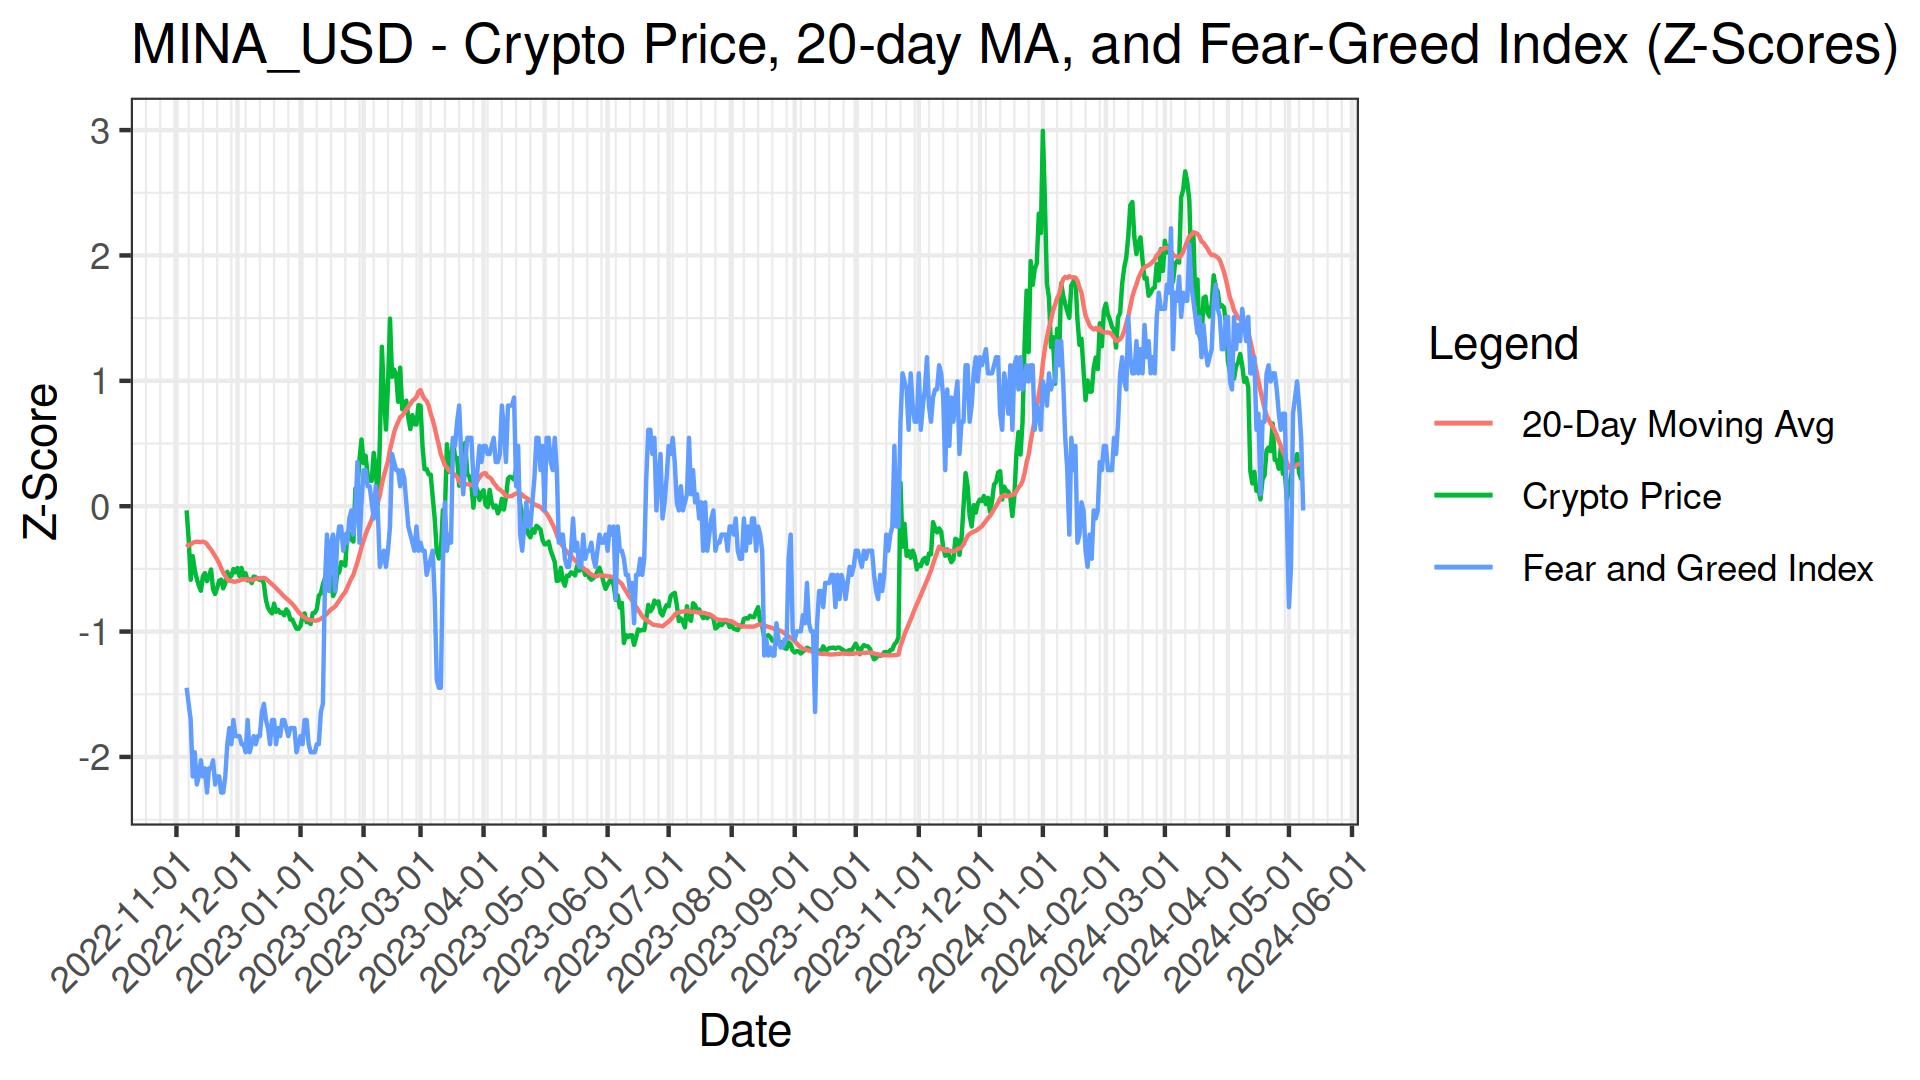
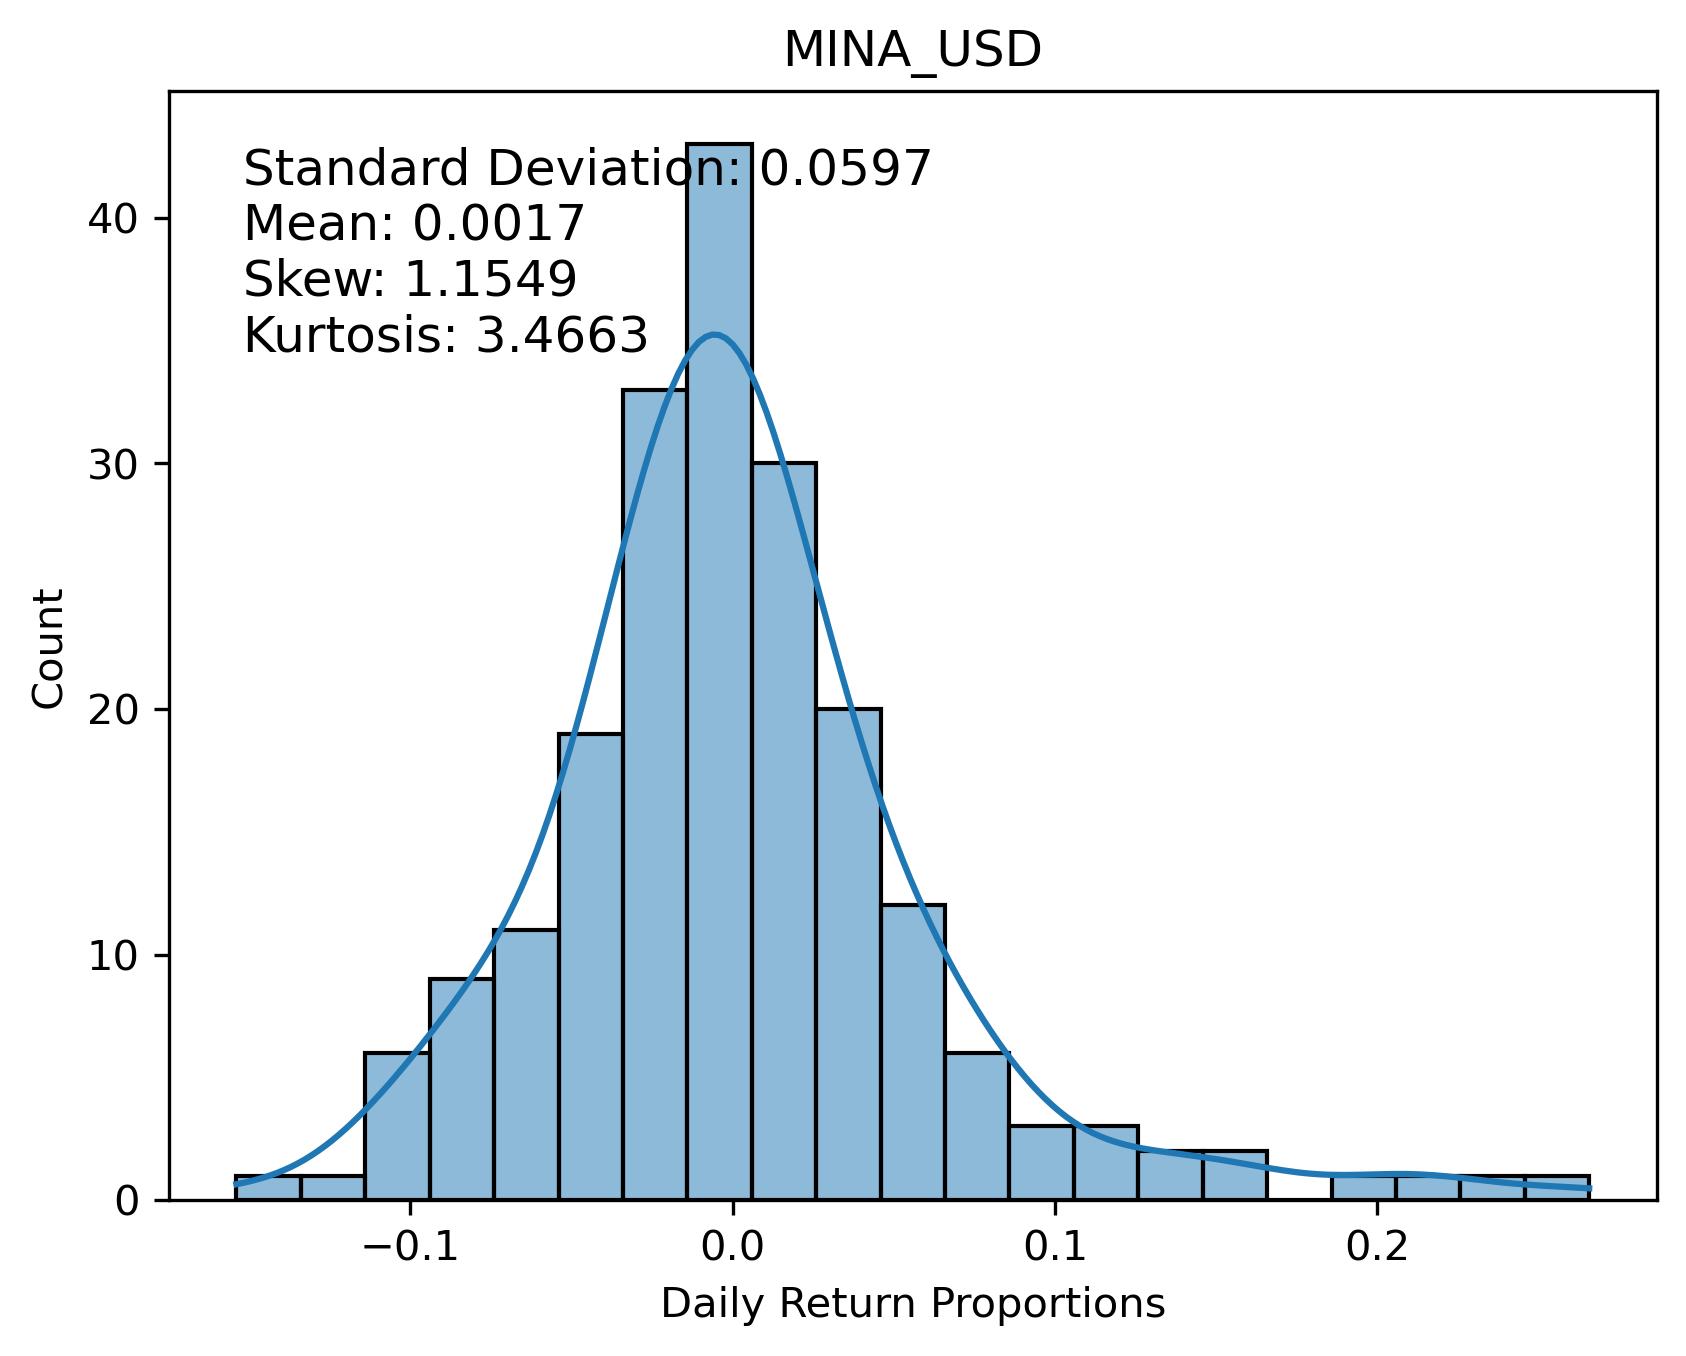
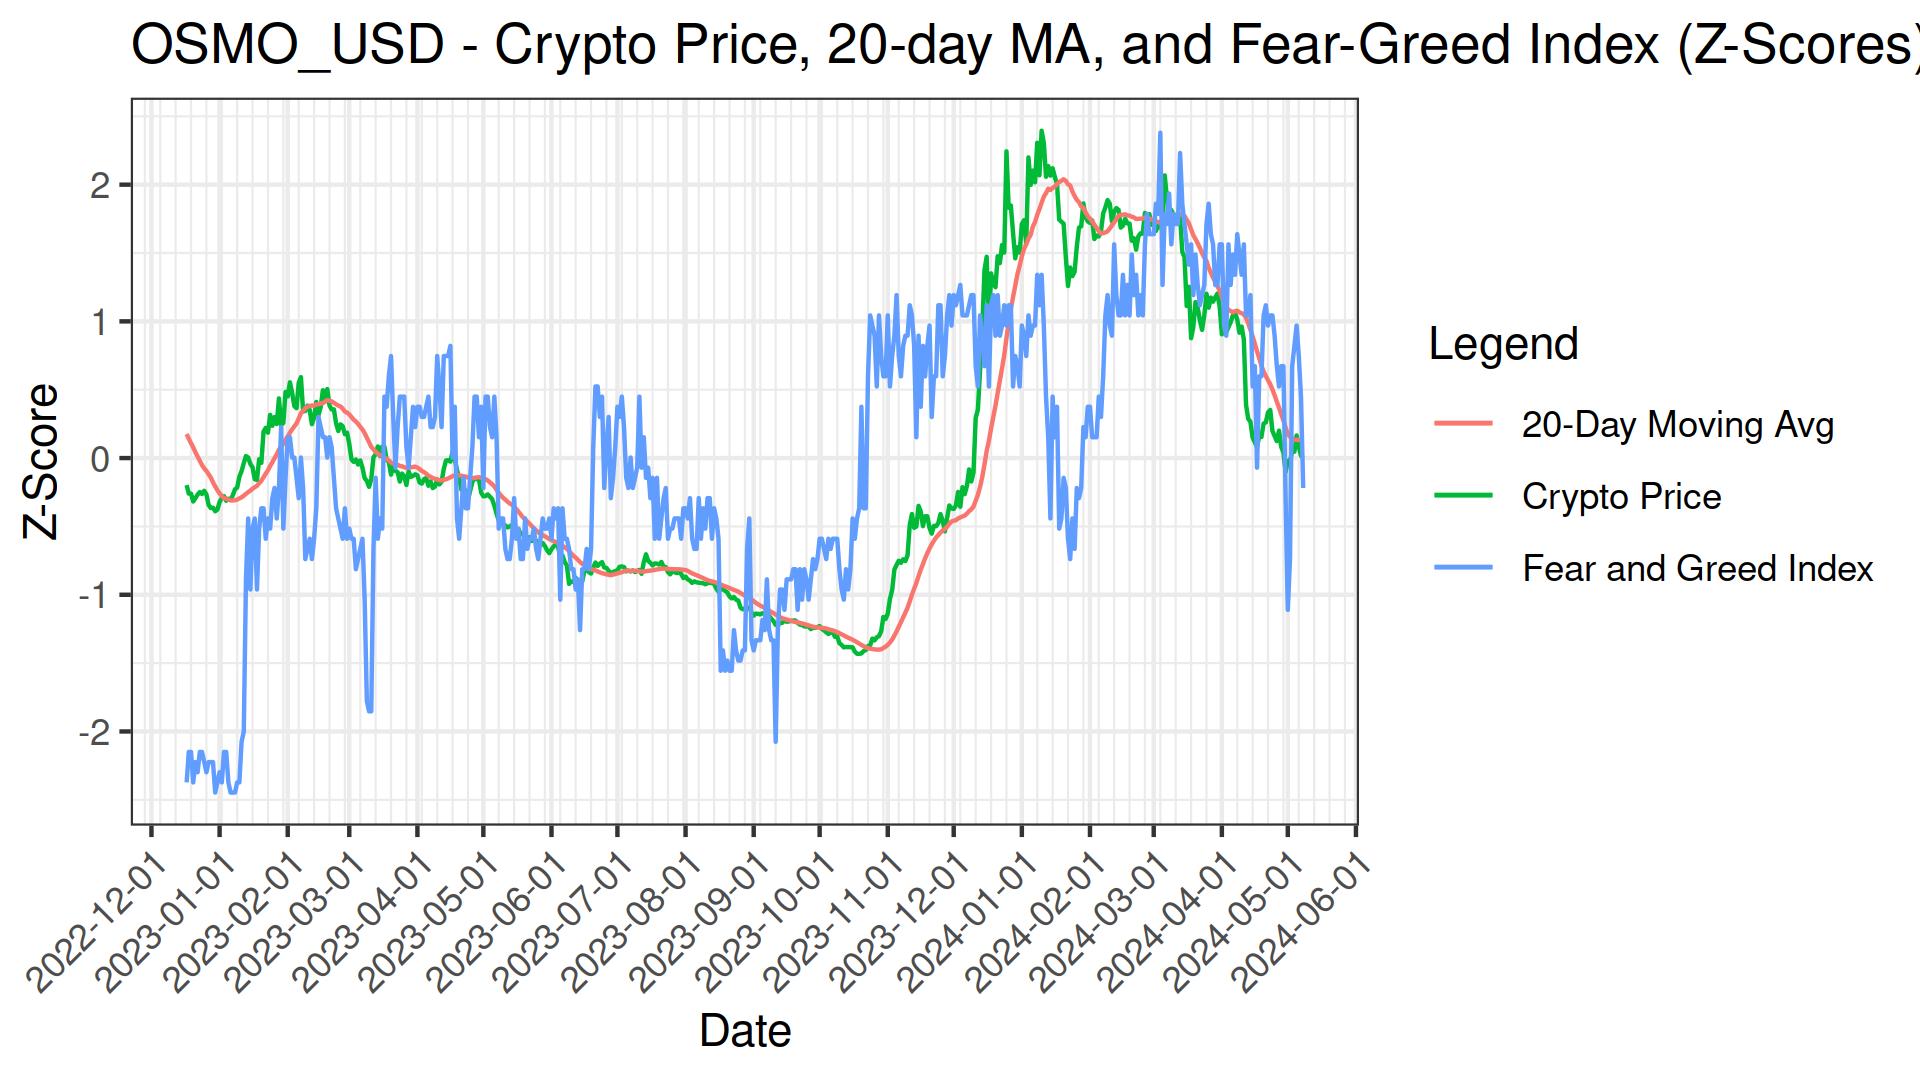
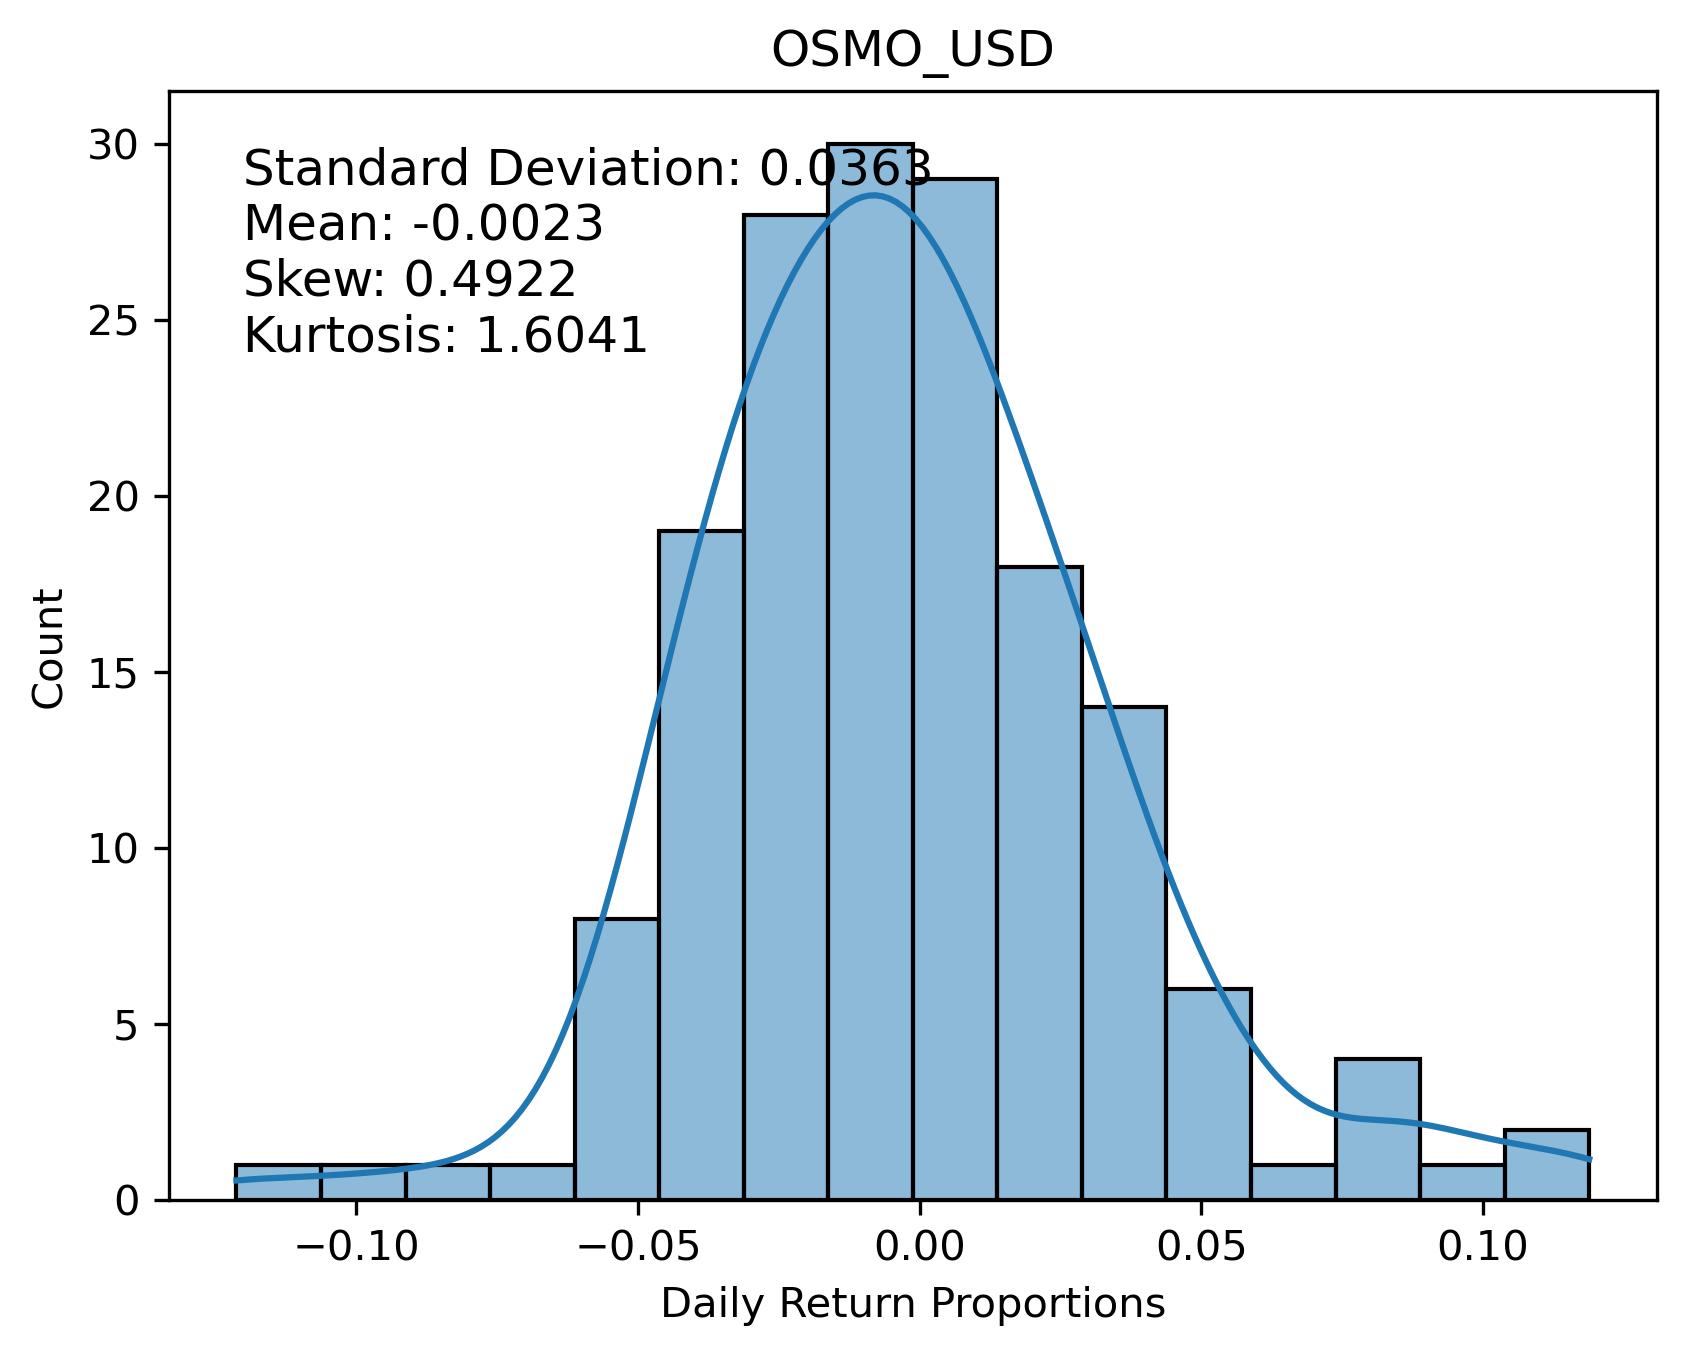
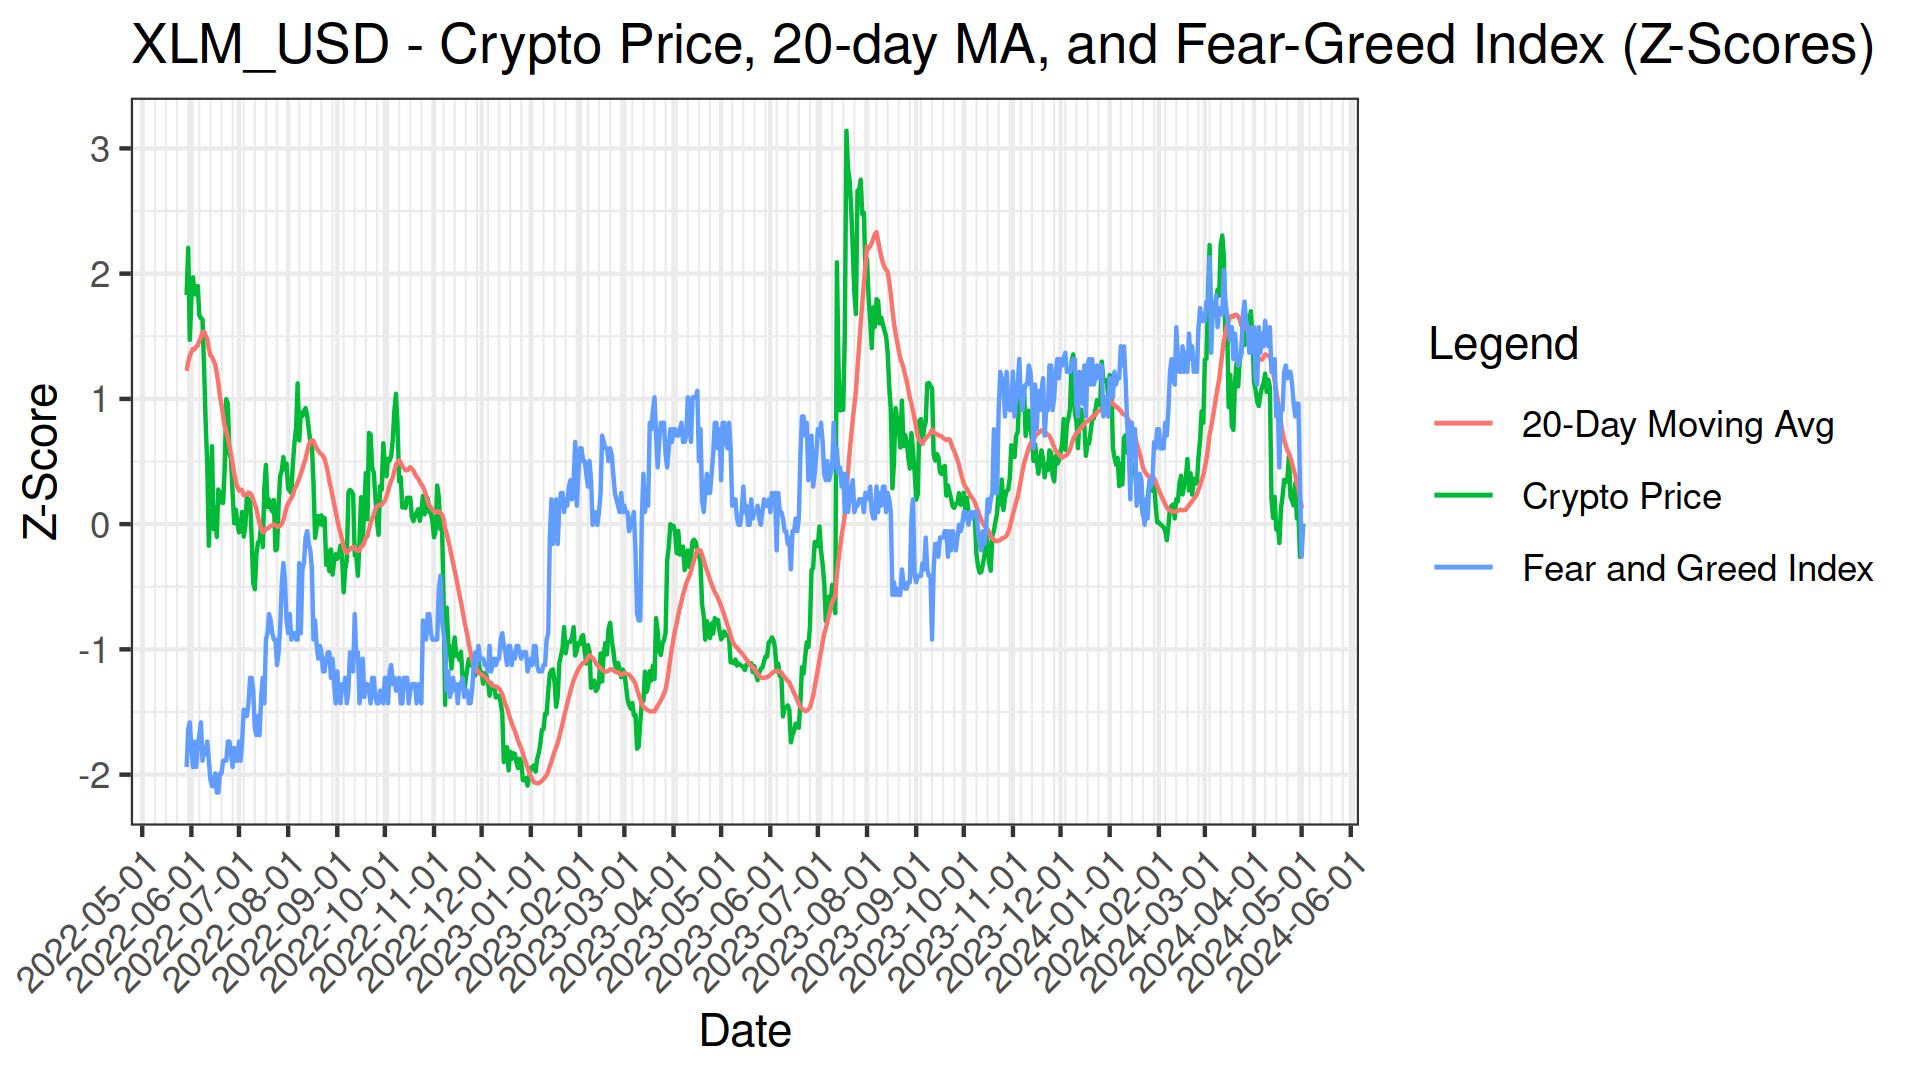
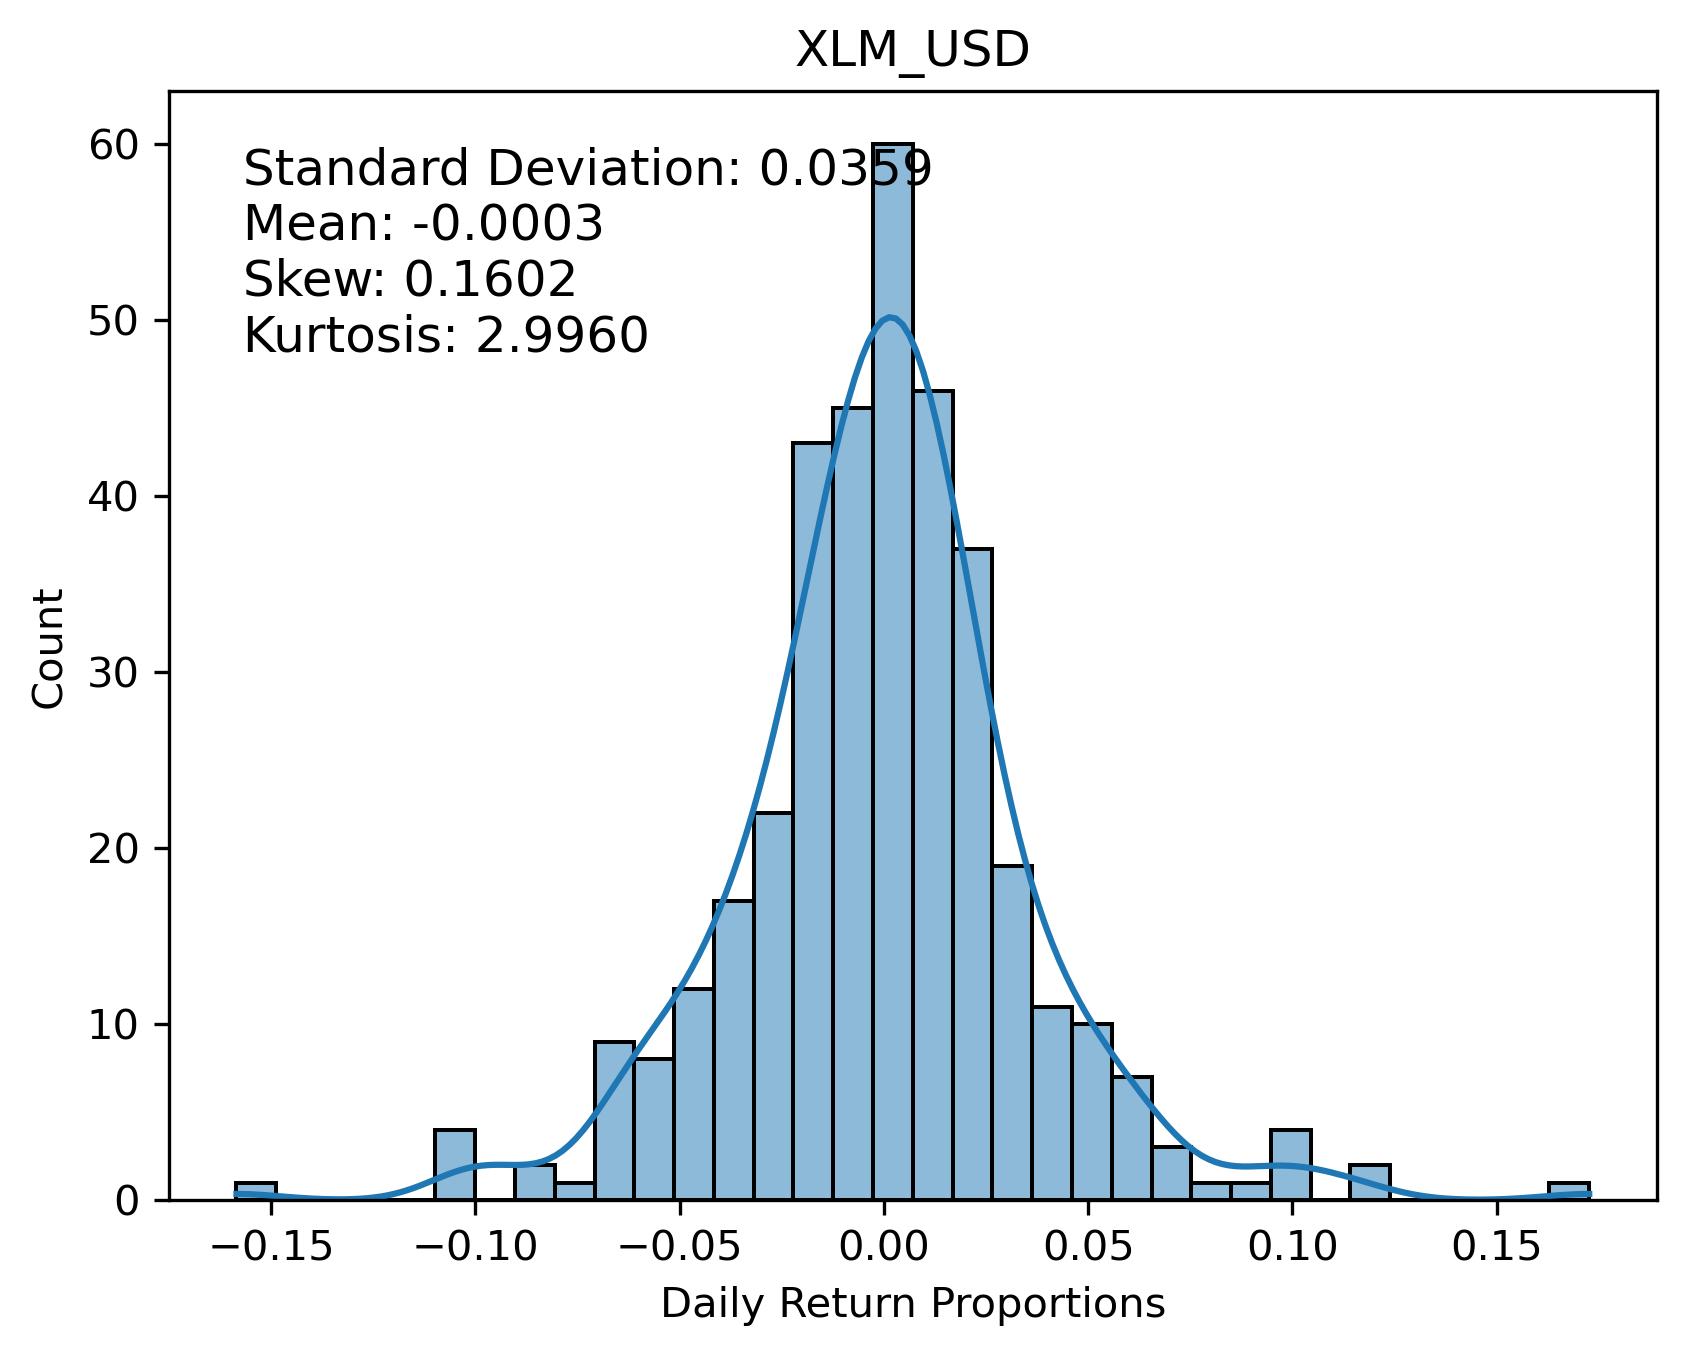
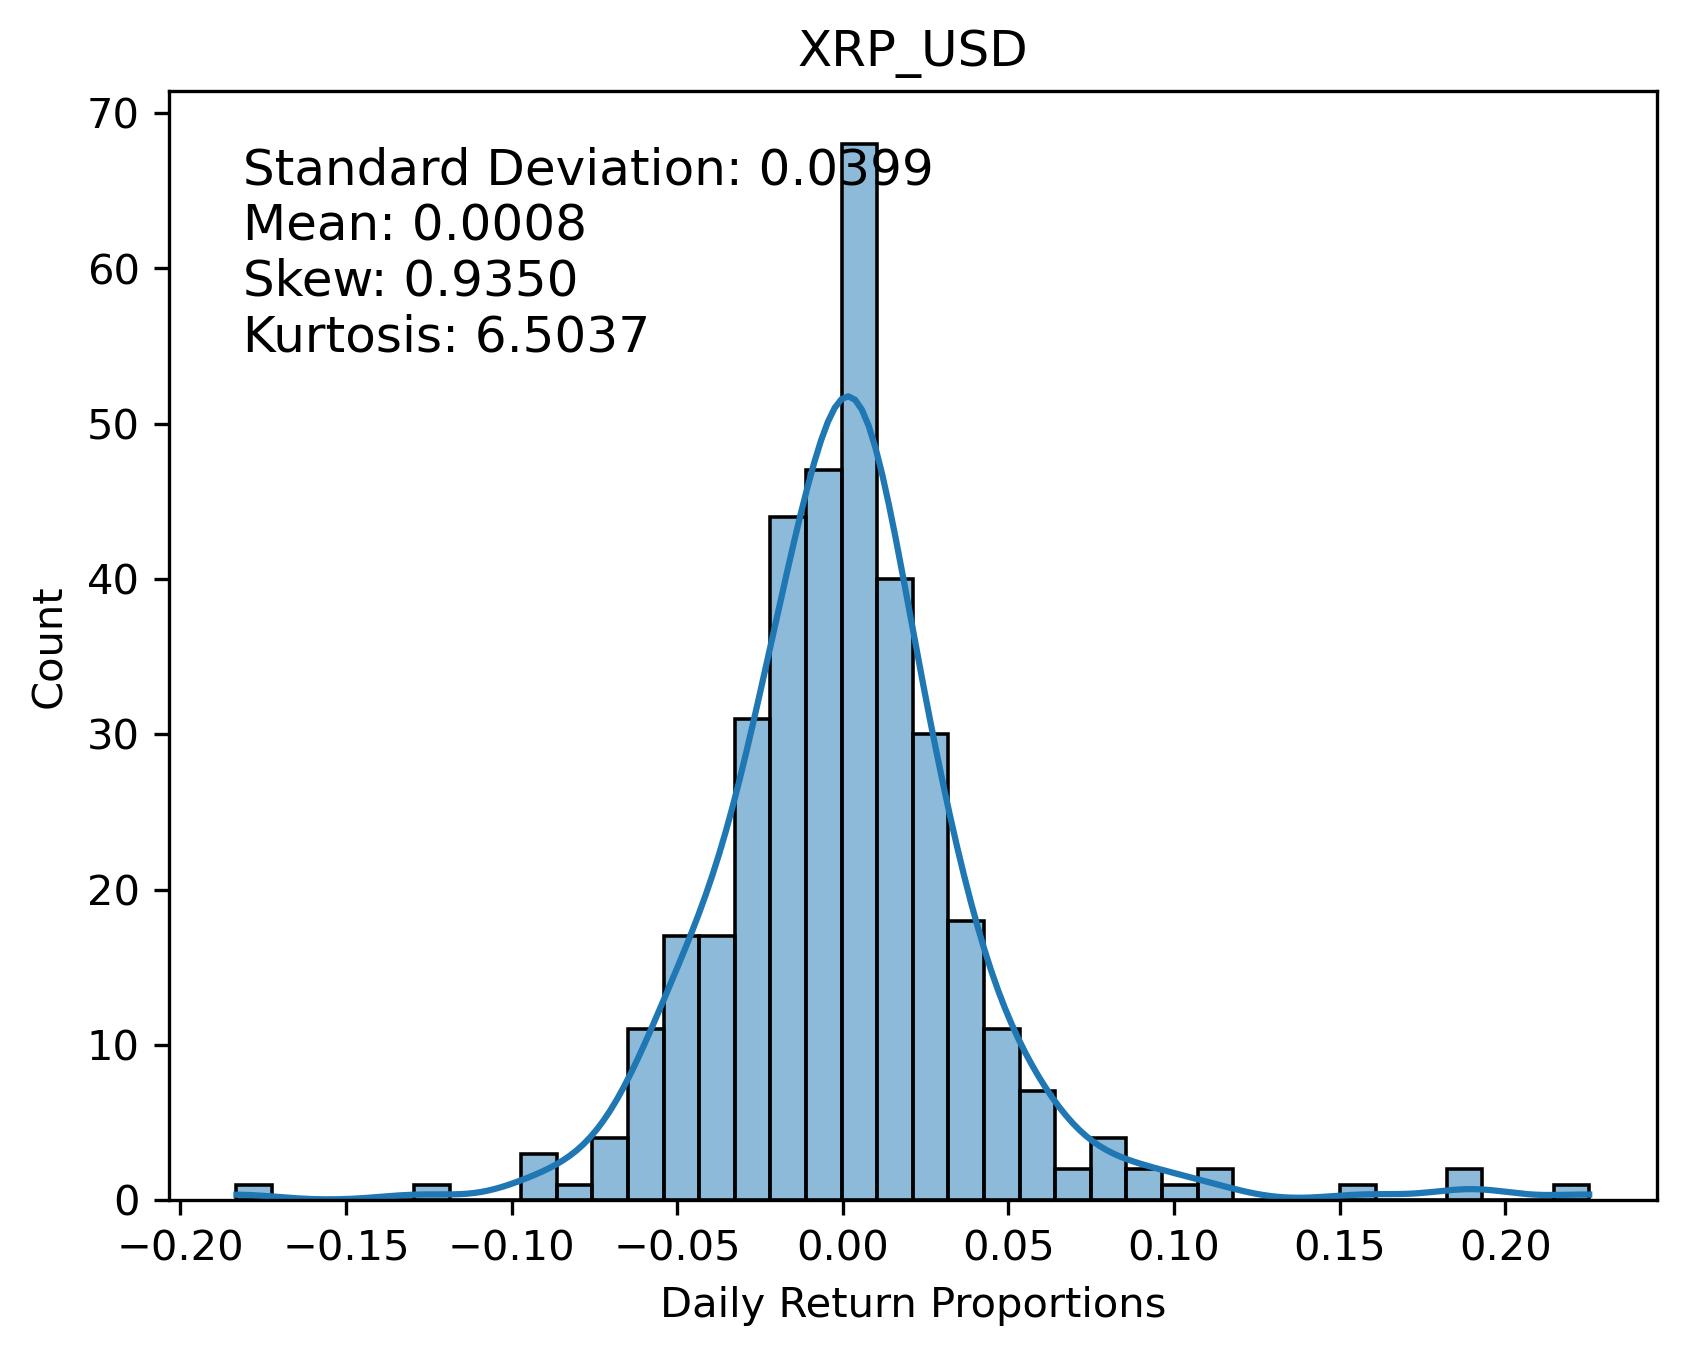
close: $0.42
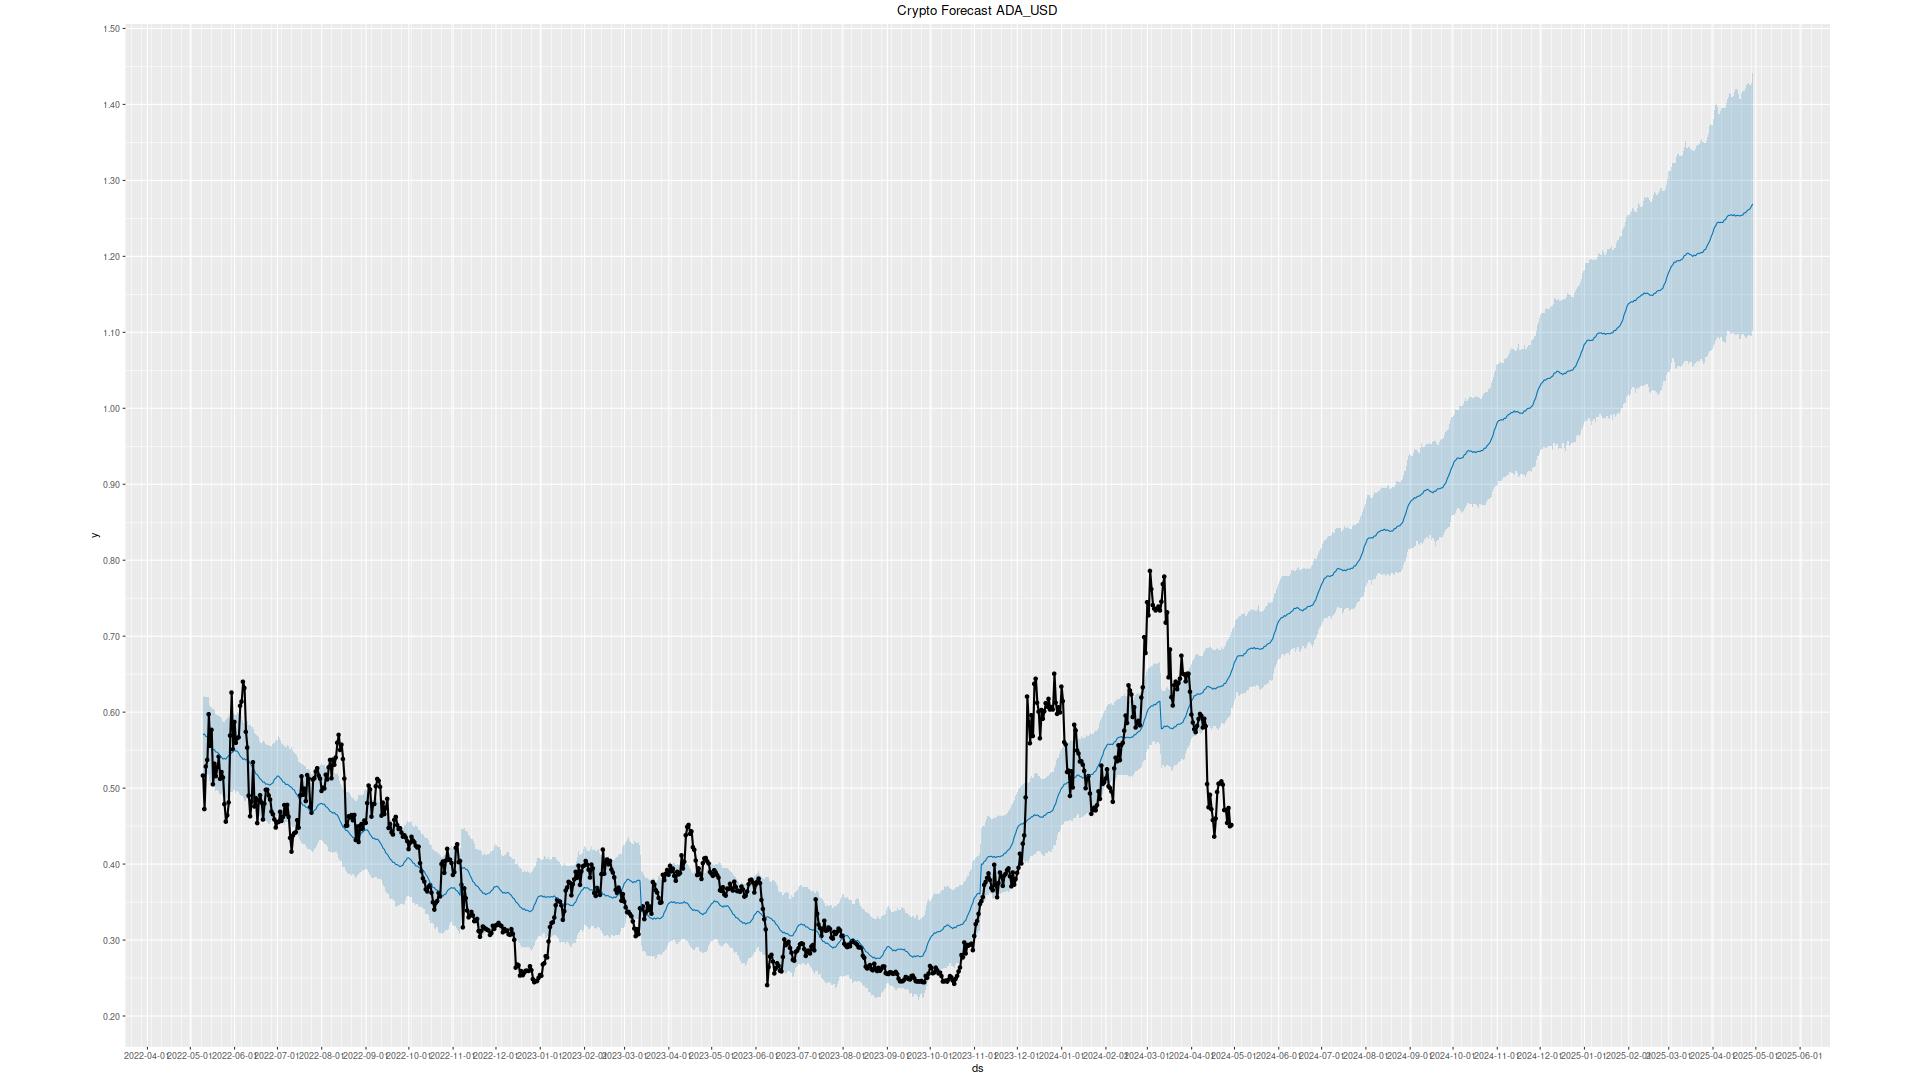
pearsons cor(100-days): 0.6076
| Return Value | Short MA | Long MA | Buy Date | Sell Date | Latest Action | Sharpe Ratio | Drawdown |
|---|---|---|---|---|---|---|---|
| 179.27% | 13 | 194 | 2023-11-04 | 2024-04-20 | 1.56 | -2.19% | |
| 166.21% | 16 | 89 | 2024-02-10 | 2024-04-12 | 1.82 | -1.17% | |
| 158.00% | 16 | 92 | 2024-02-08 | 2024-04-12 | 1.73 | -1.80% | |
| 151.98% | 11 | 199 | 2023-11-04 | 2024-04-19 | 1.09 | -7.57% | |
| 149.50% | 16 | 88 | 2024-02-10 | 2024-04-12 | 1.52 | -2.60% | |
| 149.41% | 16 | 94 | 2024-02-07 | 2024-04-12 | 1.49 | -3.10% | |
| 149.13% | 13 | 193 | 2023-11-04 | 2024-04-20 | 1.08 | -2.64% |
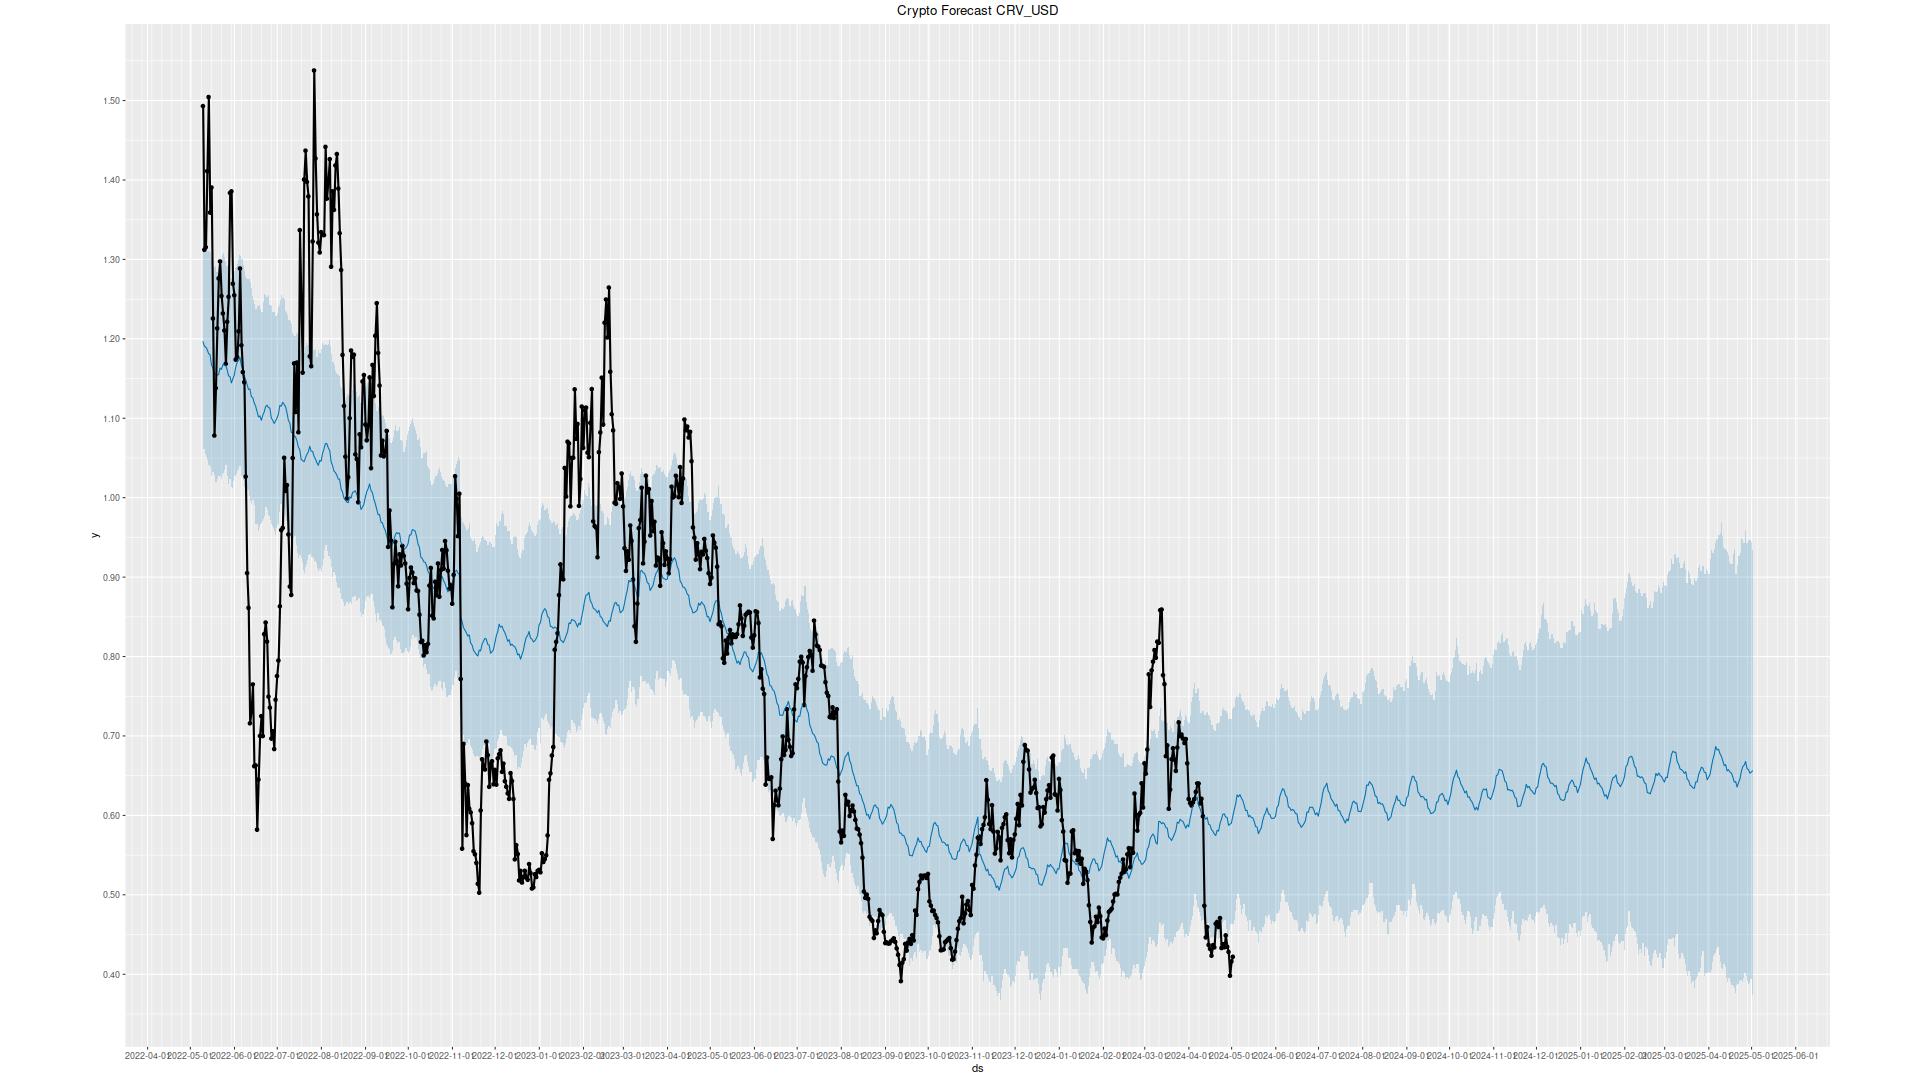
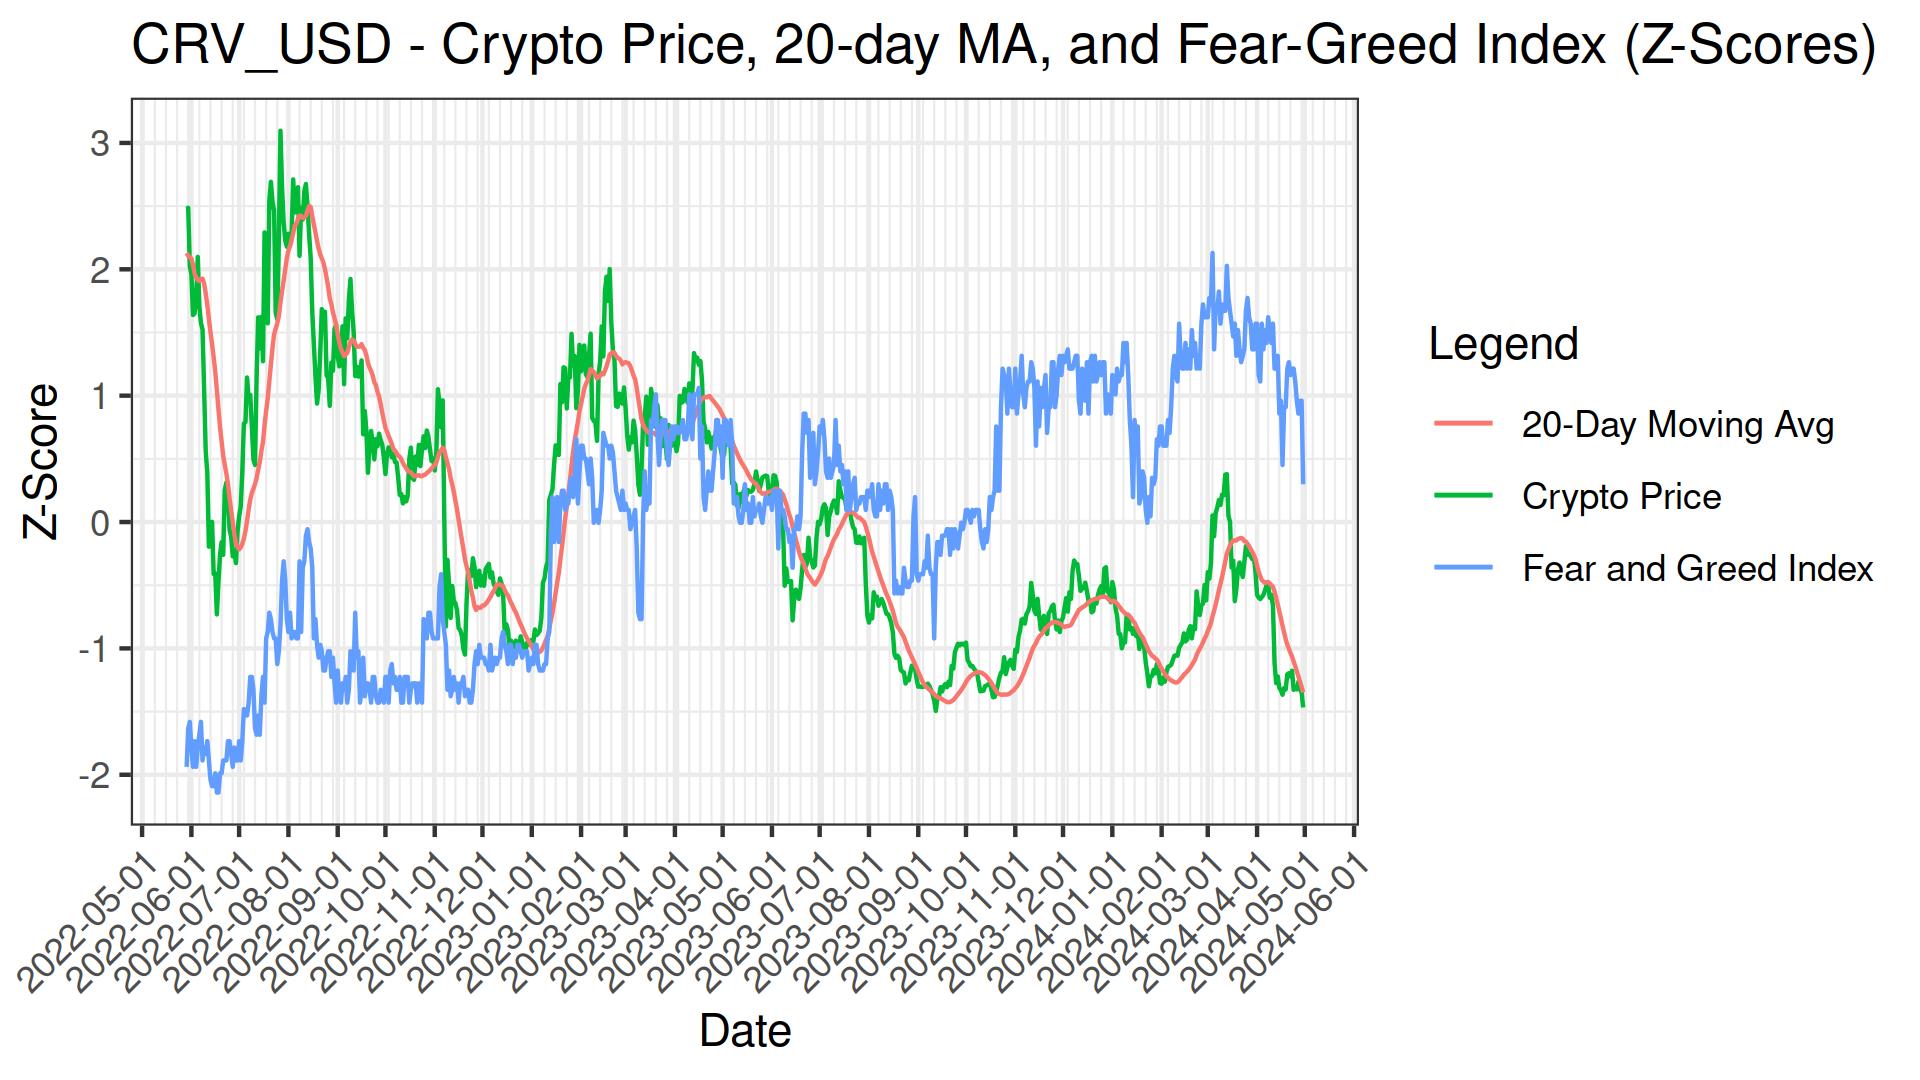
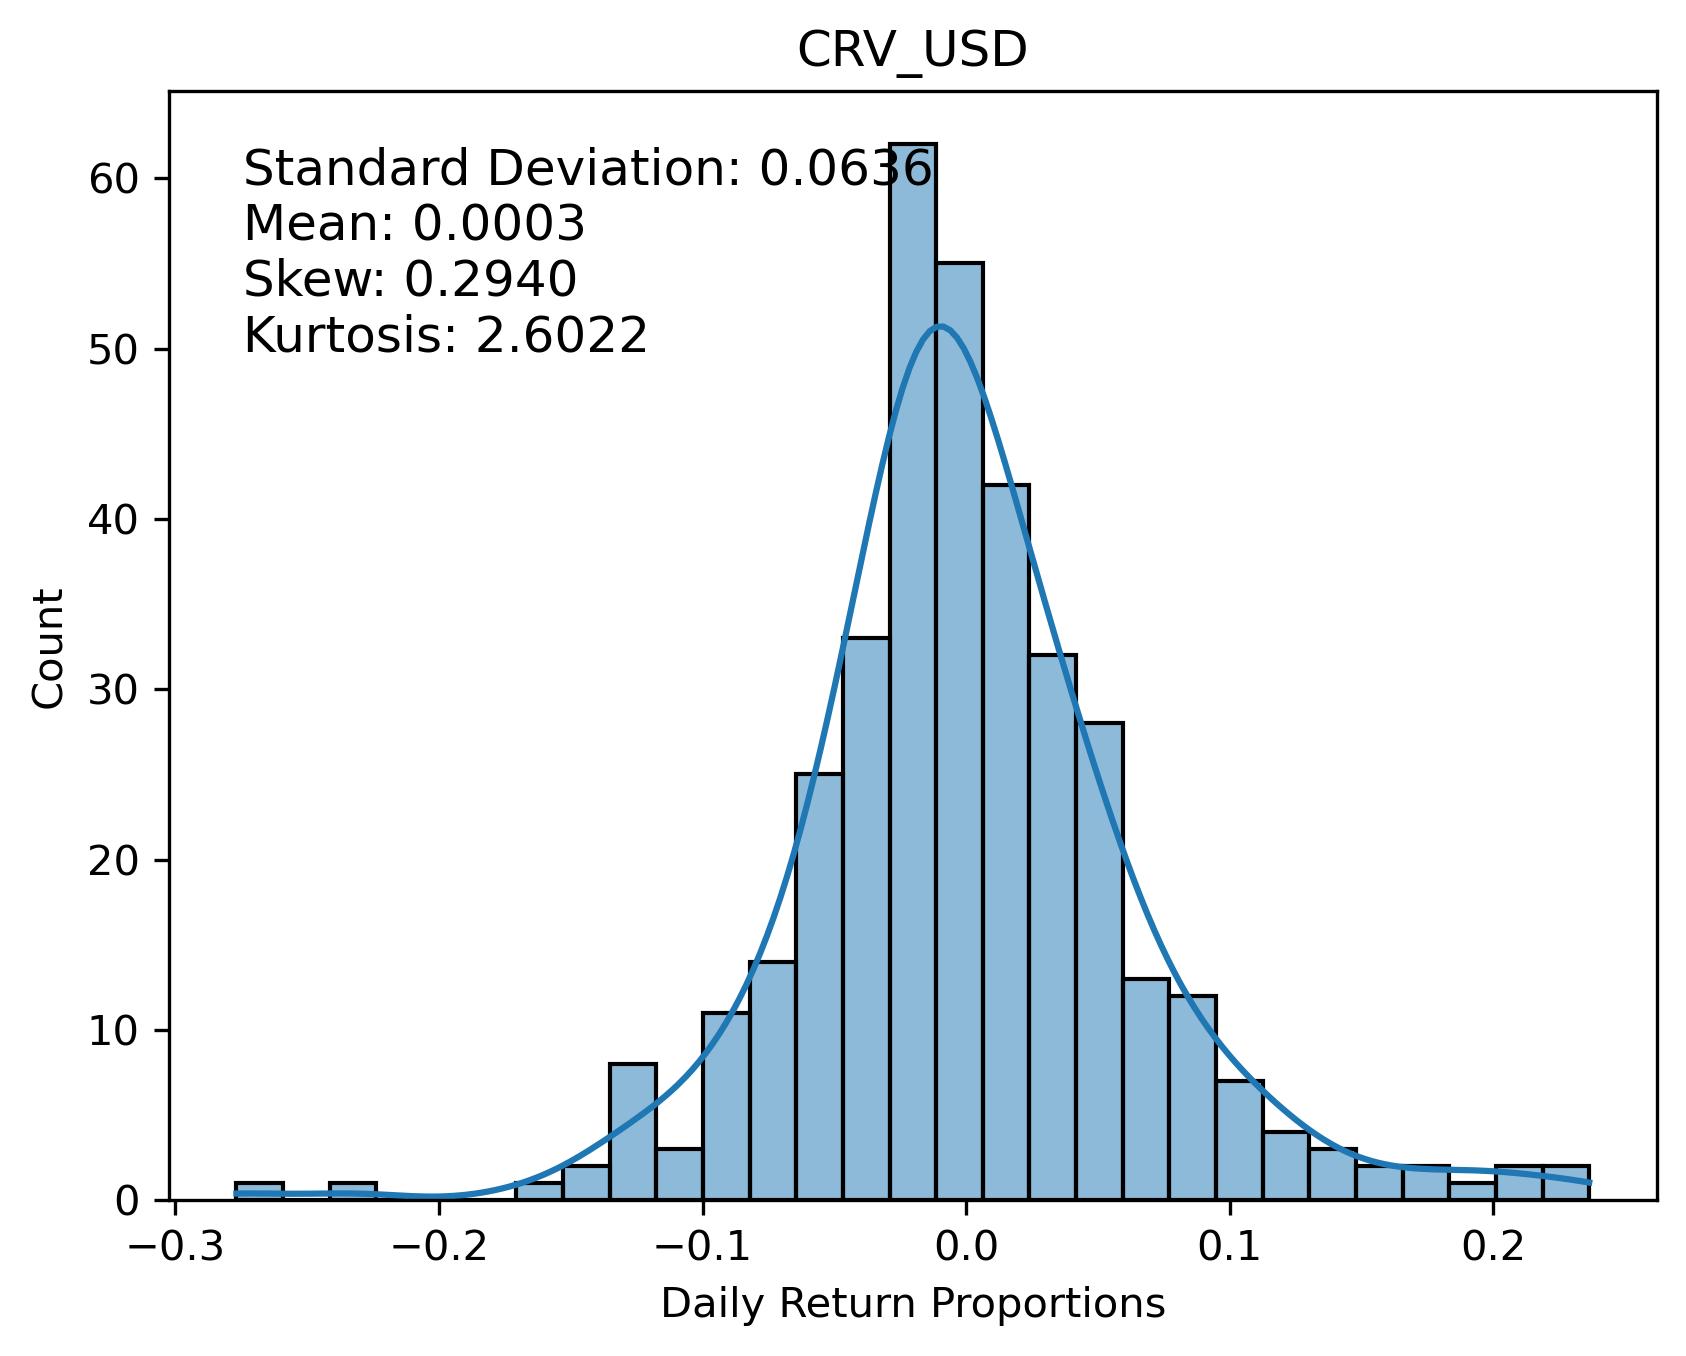
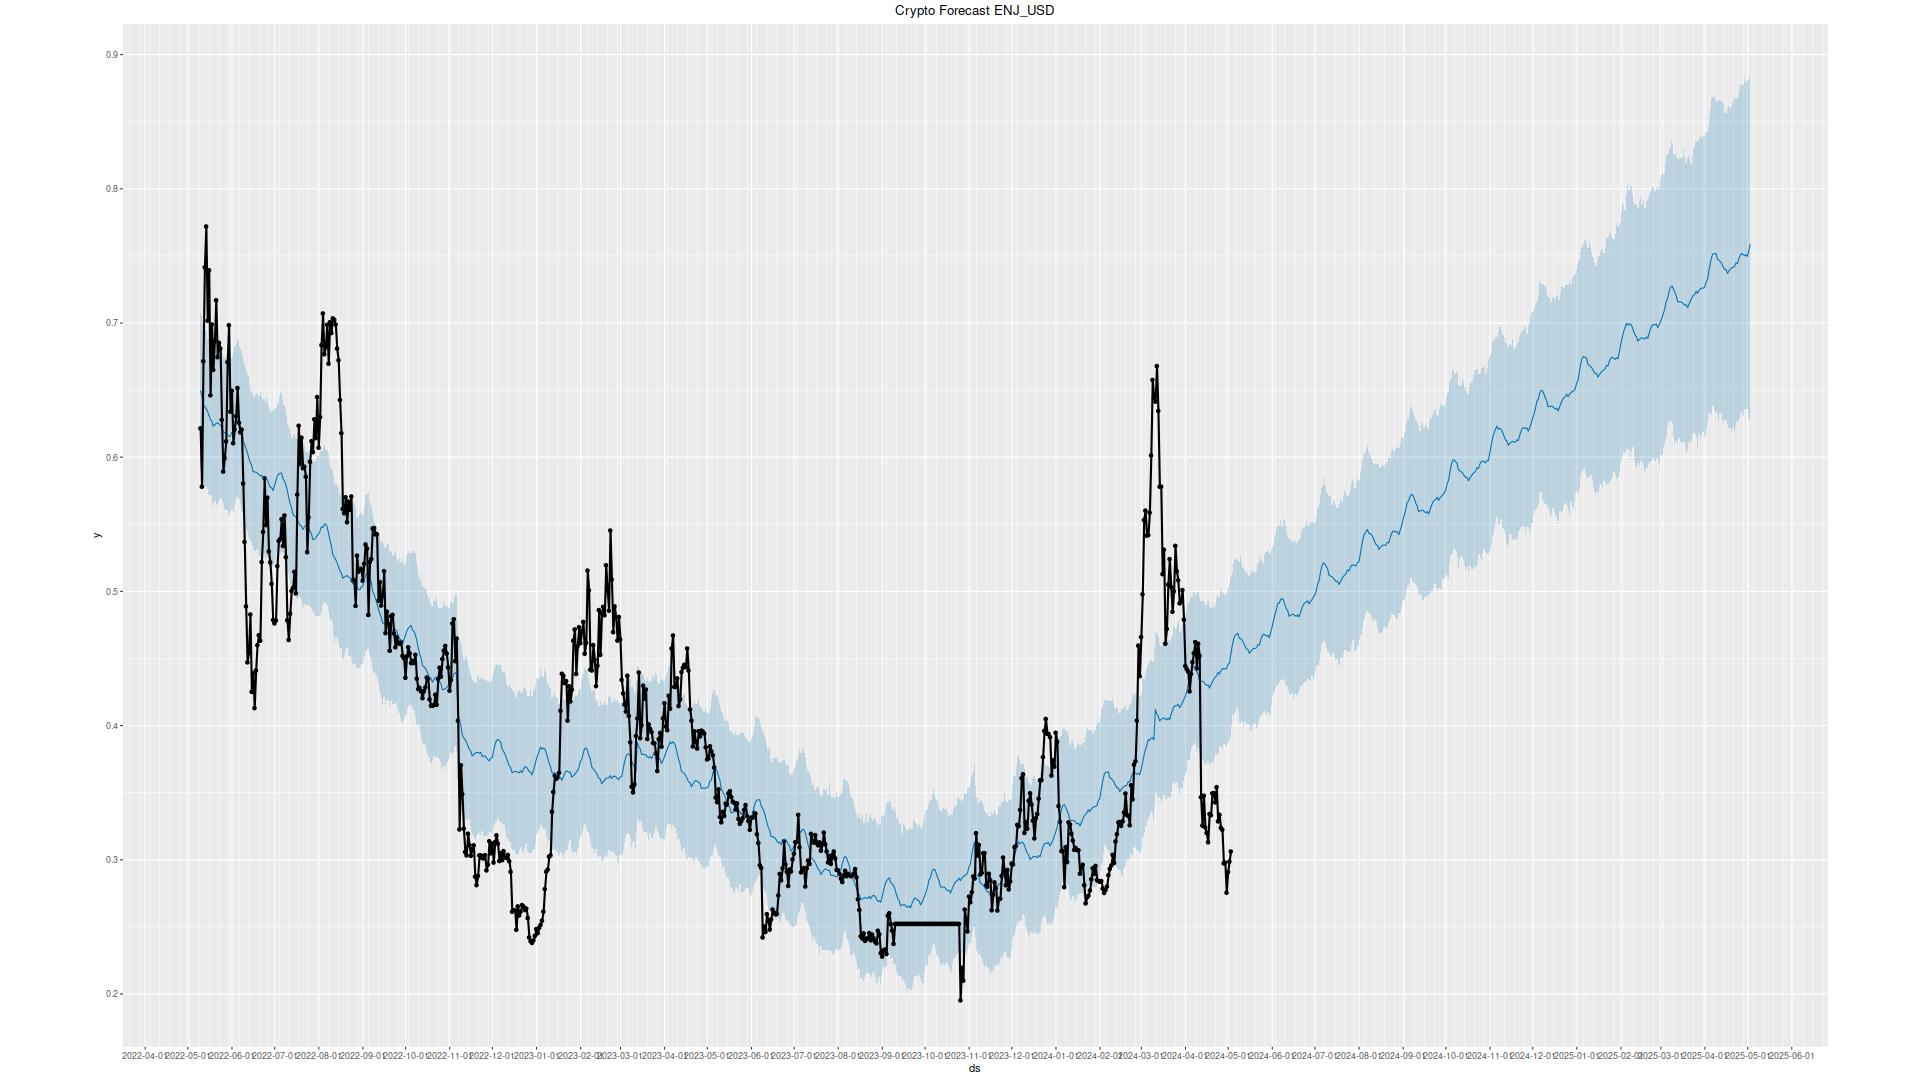
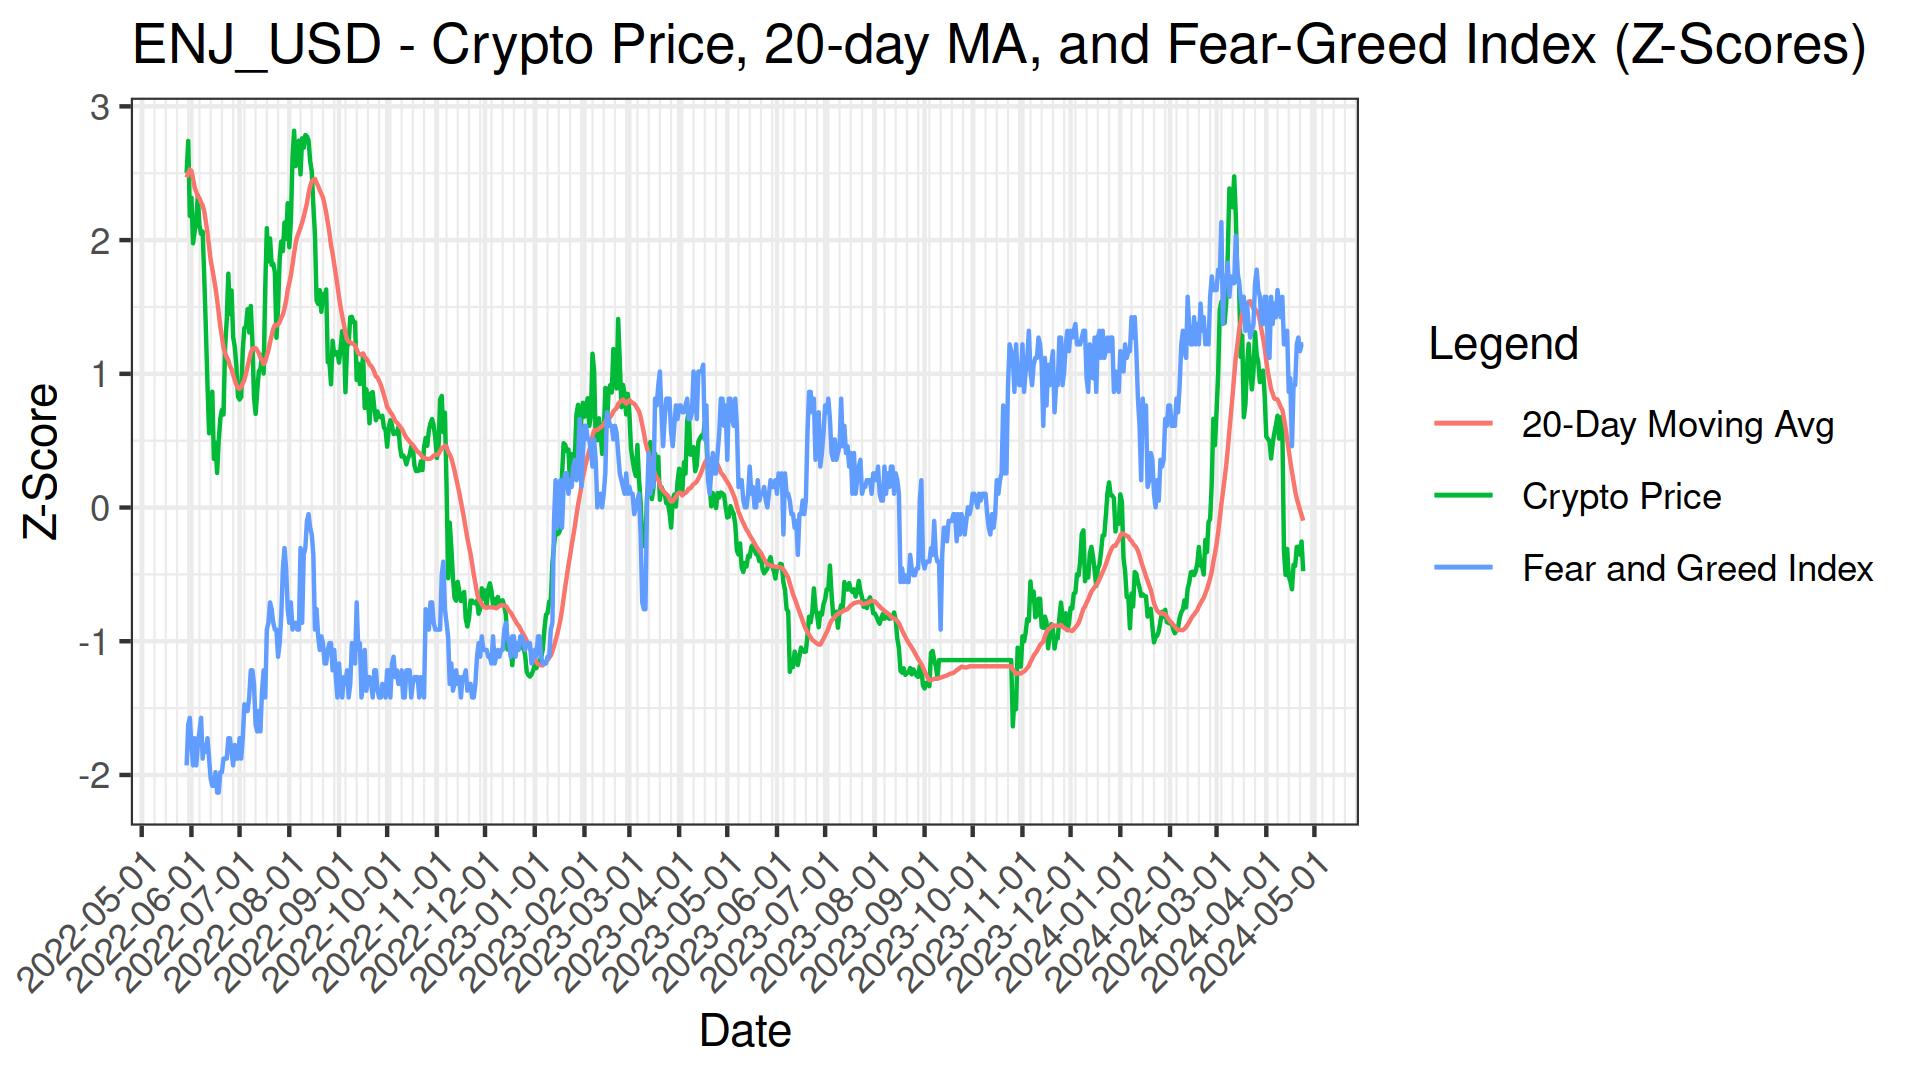
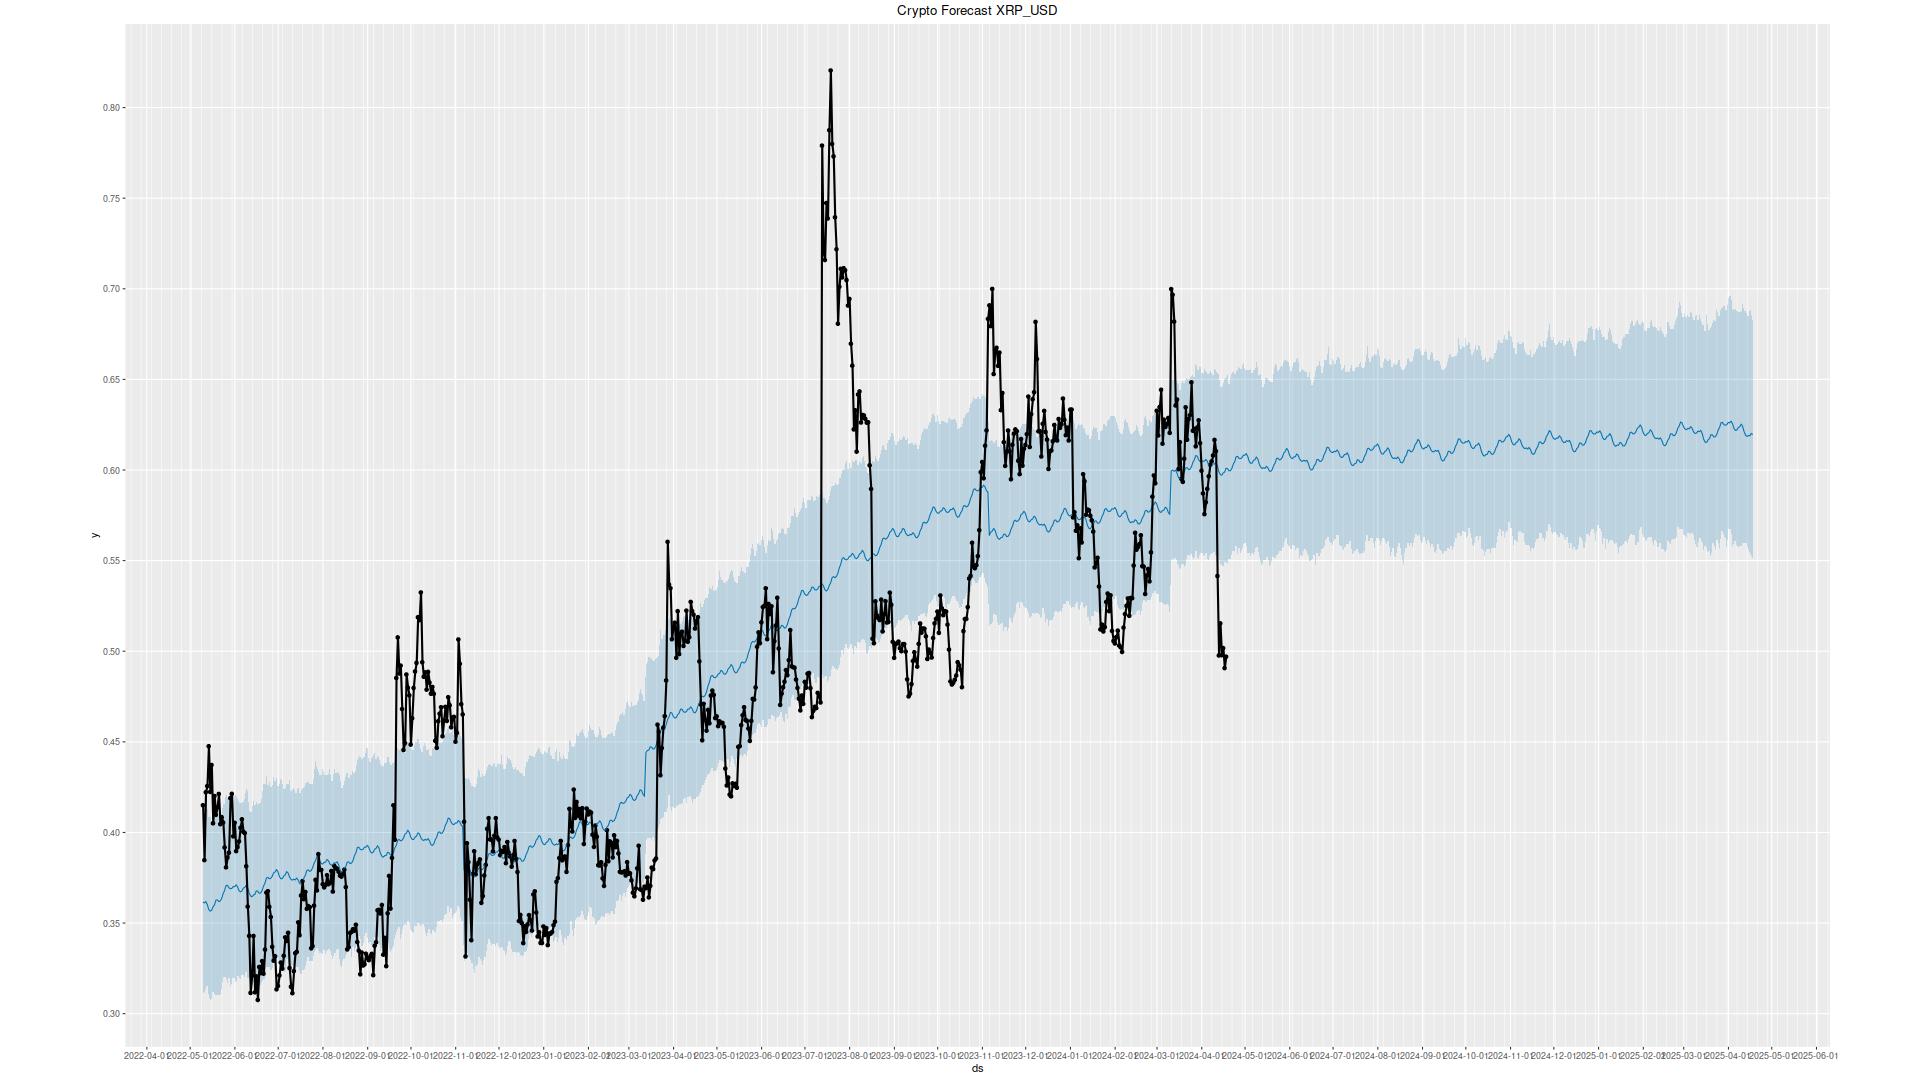
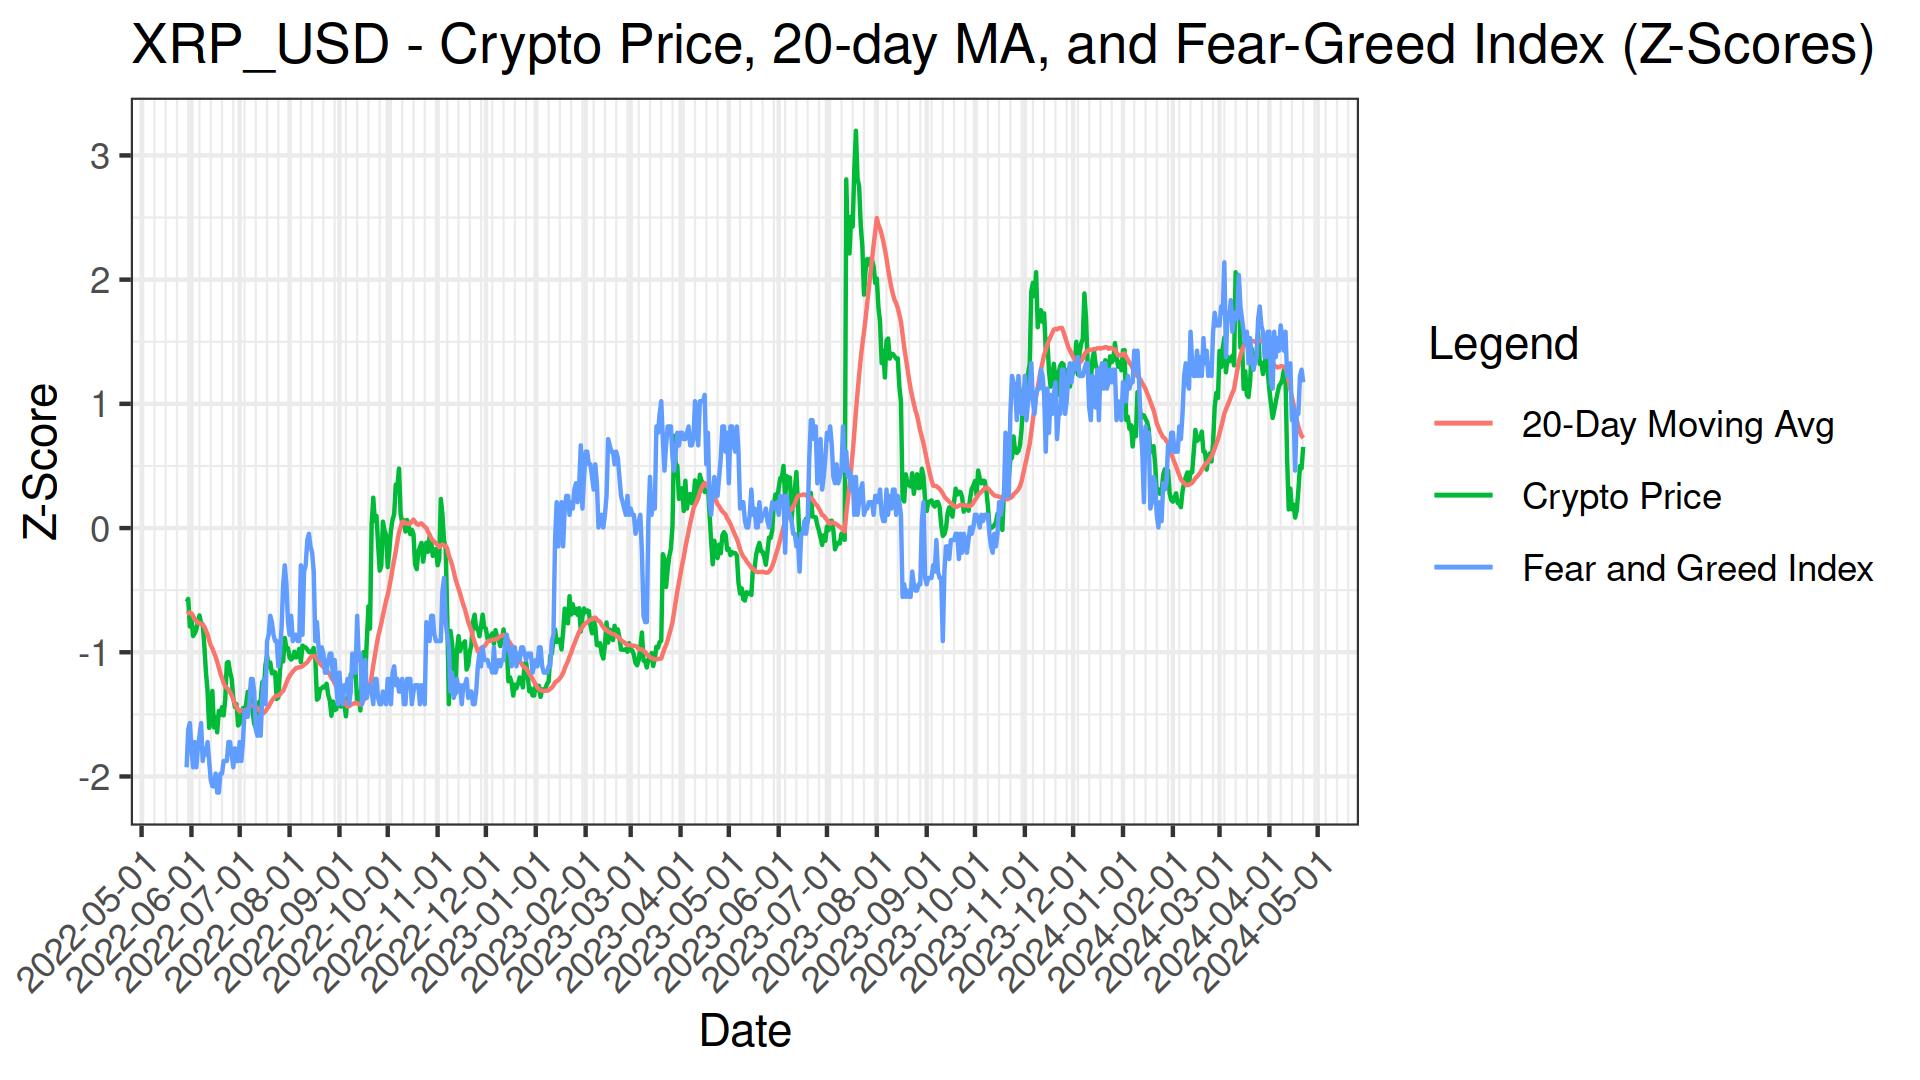
close: $0.79
pearsons cor(100-days): 0.6237
| Return Value | Short MA | Long MA | Buy Date | Sell Date | Latest Action | Sharpe Ratio | Drawdown |
|---|---|---|---|---|---|---|---|
| 179.78% | 13 | 94 | 2024-02-19 | 2024-04-12 | 1.62 | -0.90% | |
| 168.76% | 14 | 55 | 2024-06-01 | 2024-06-10 | 2.16 | -0.98% | |
| 168.25% | 14 | 129 | 2024-02-17 | 2024-04-12 | 1.40 | -0.08% | |
| 167.33% | 14 | 128 | 2024-02-17 | 2024-04-12 | 1.39 | -0.08% | |
| 164.70% | 13 | 57 | 2024-06-02 | 2024-06-10 | 1.95 | -2.52% | |
| 163.49% | 12 | 56 | 2024-06-02 | 2024-06-10 | 1.92 | -1.44% | |
| 163.39% | 14 | 97 | 2024-02-19 | 2024-04-12 | 1.40 | -2.43% |
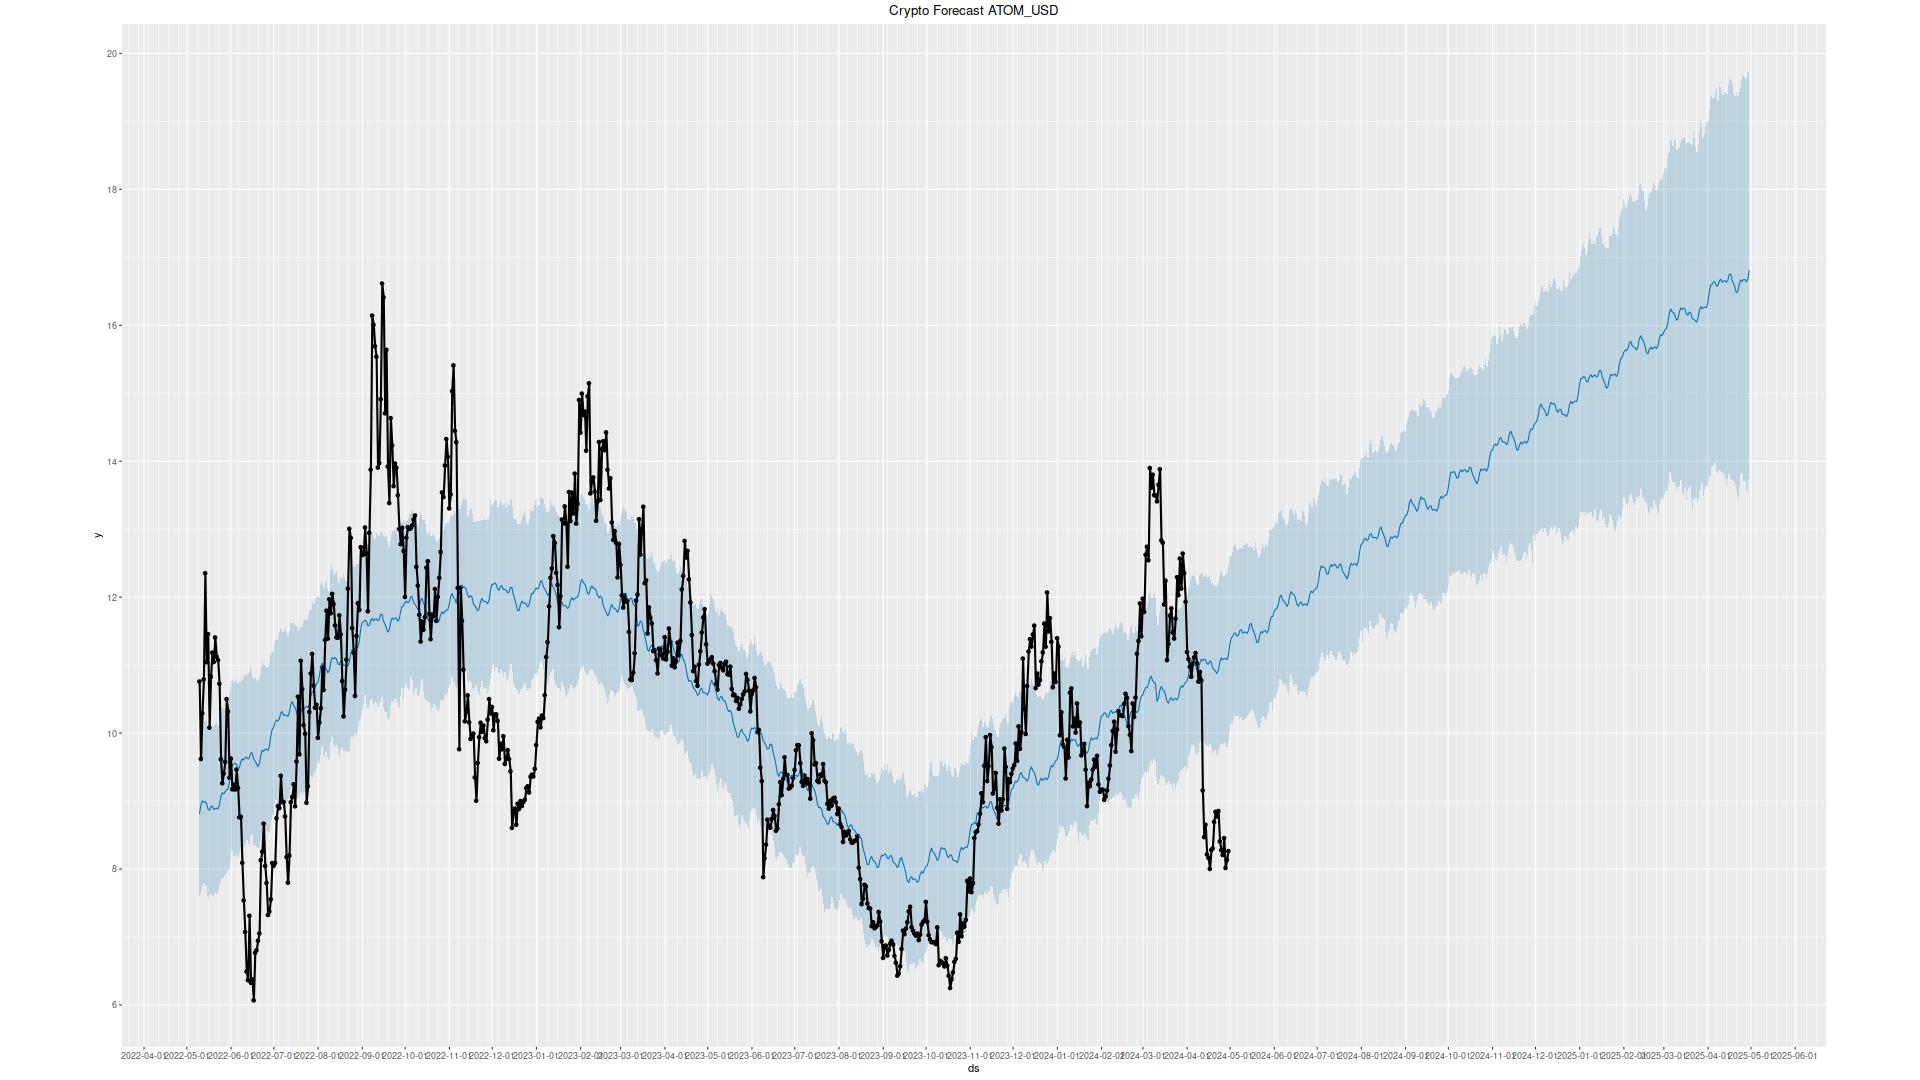
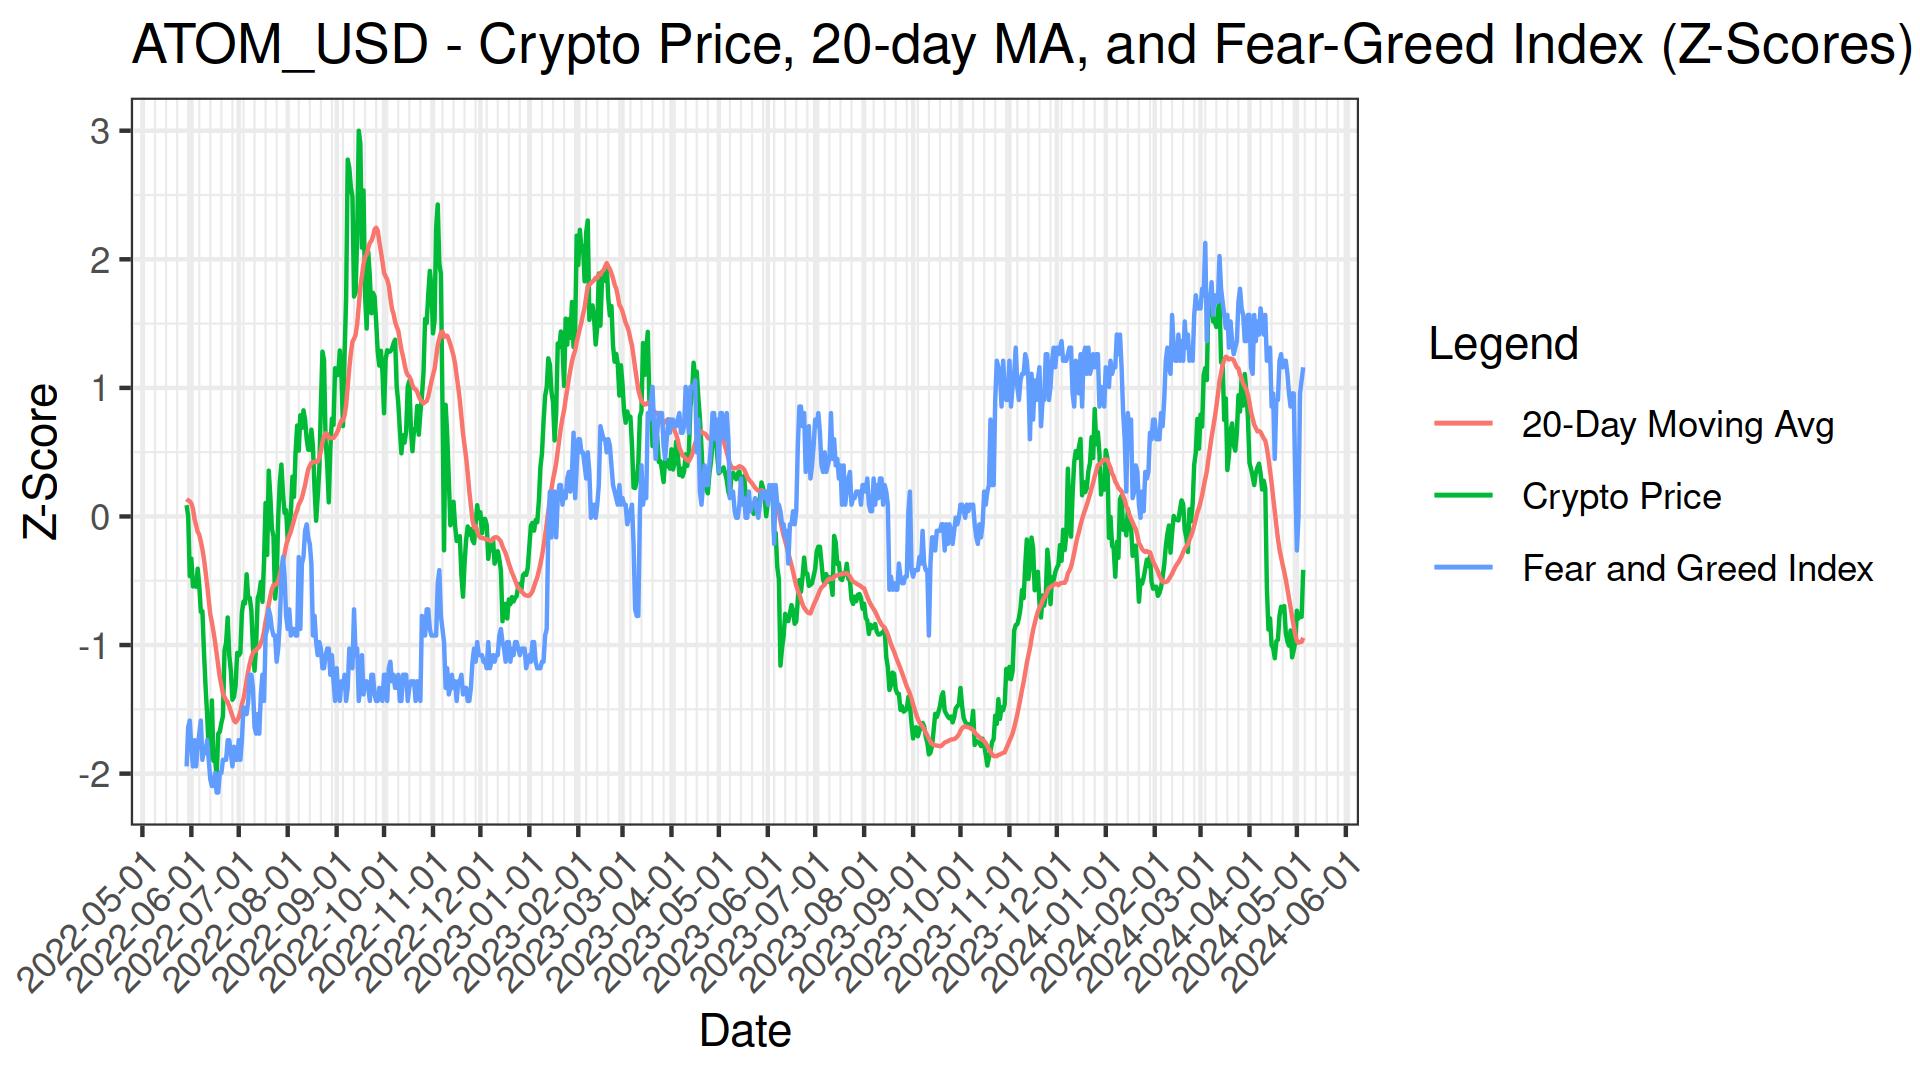
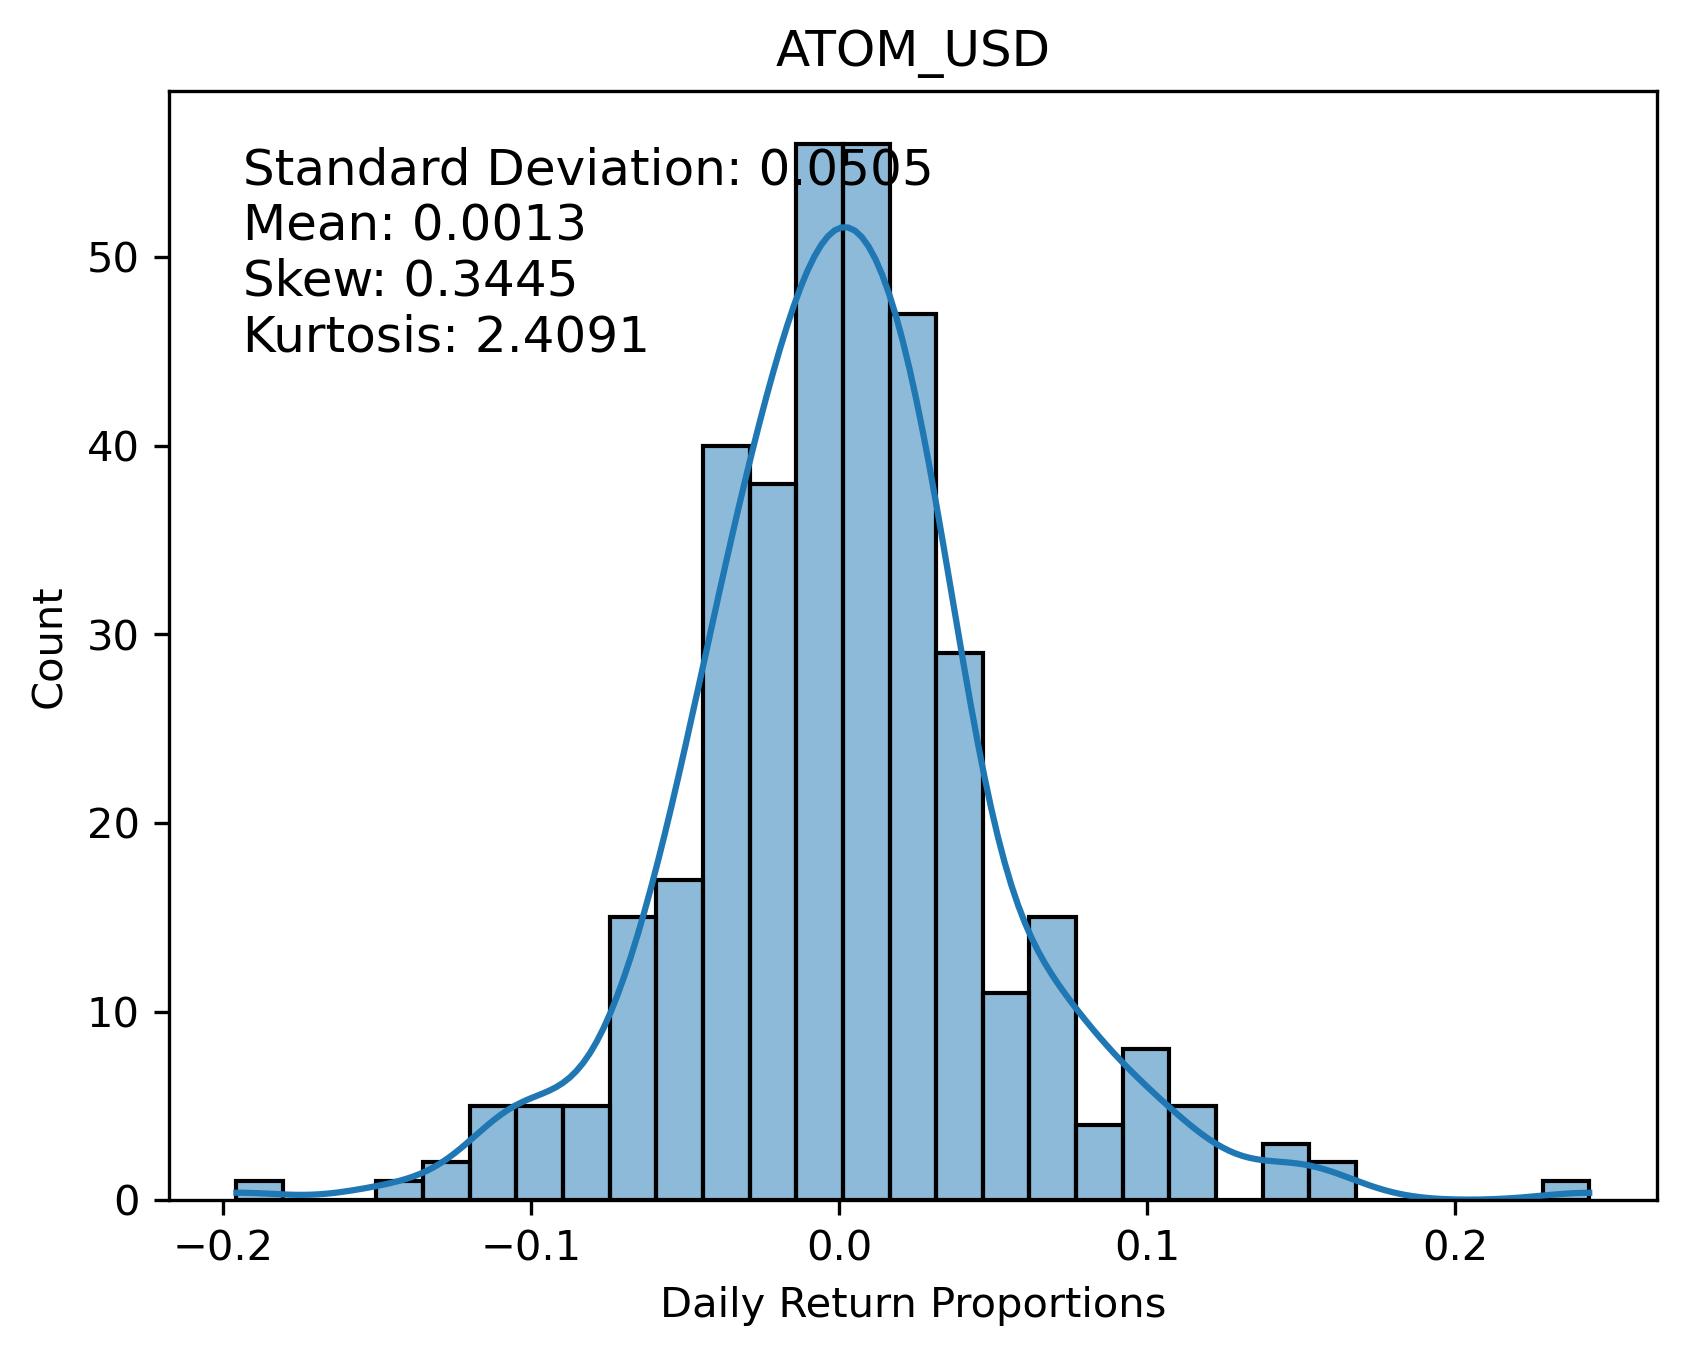
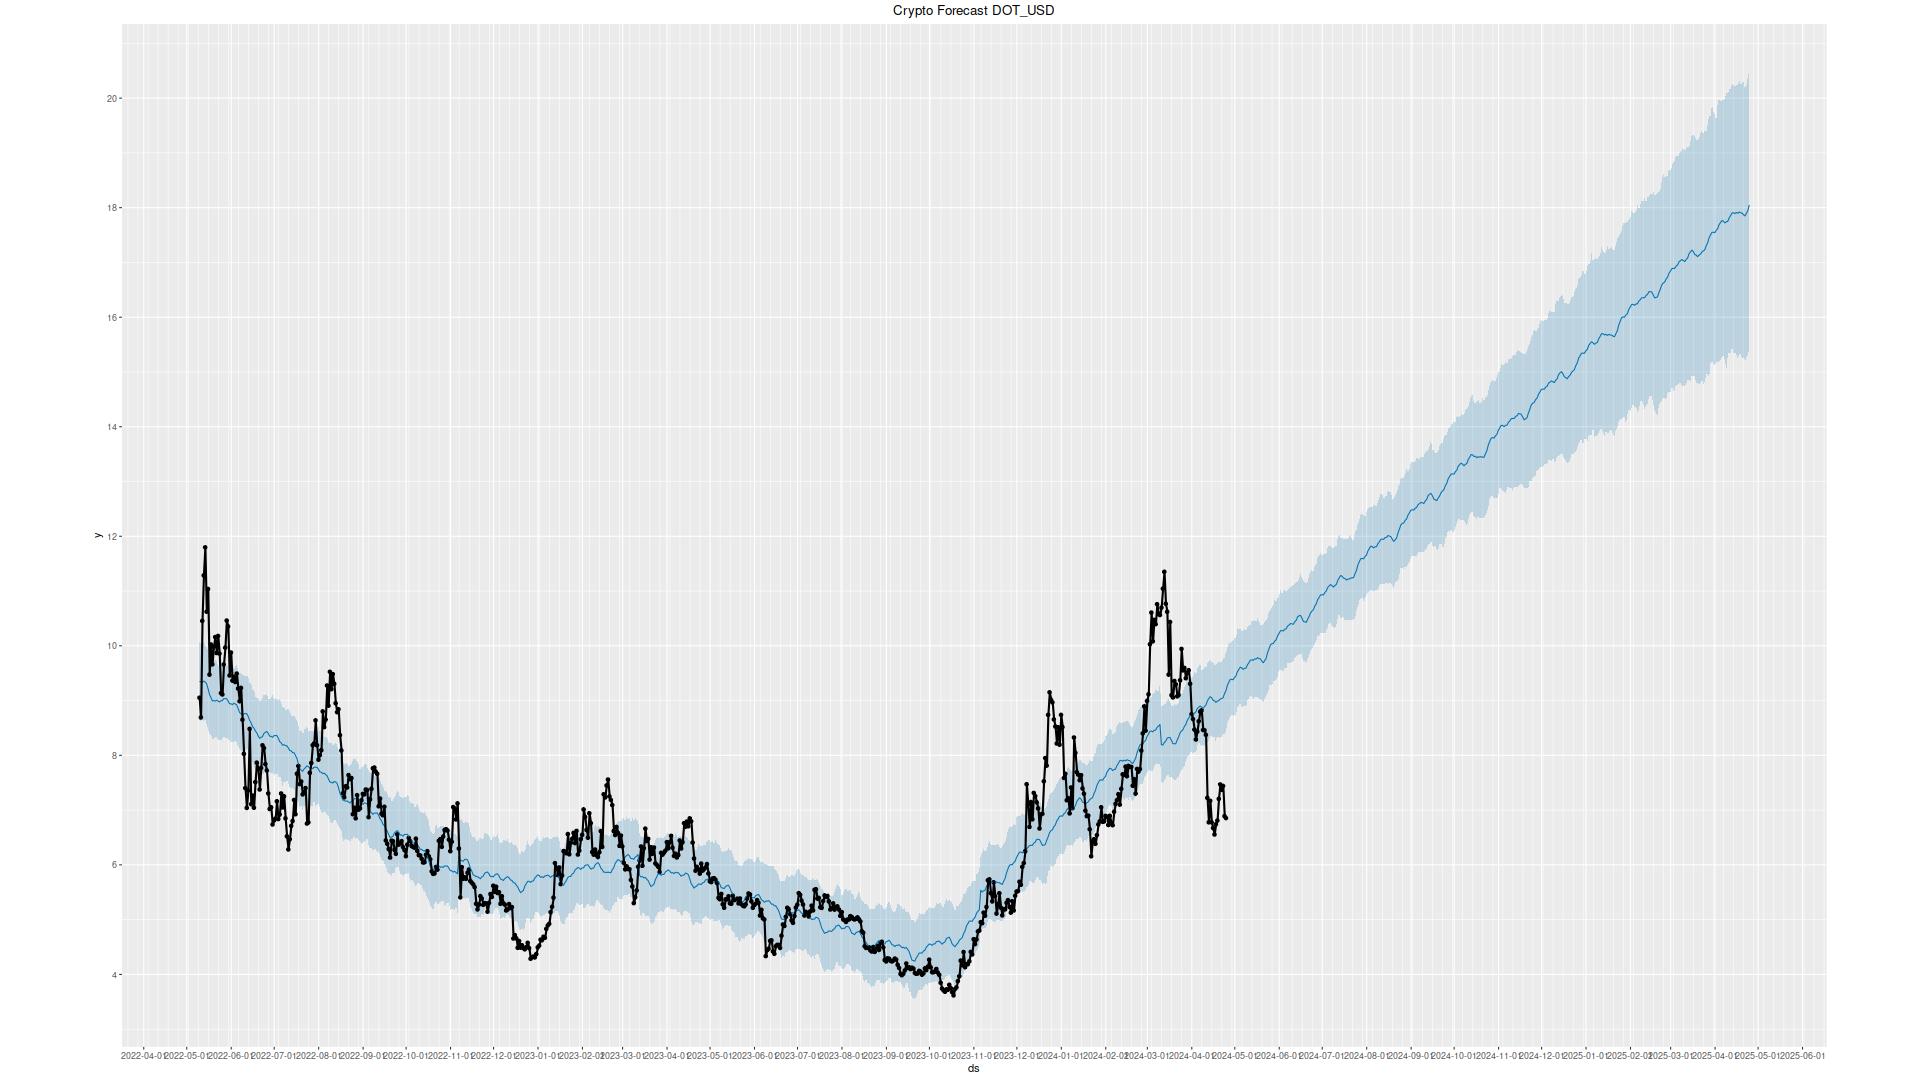
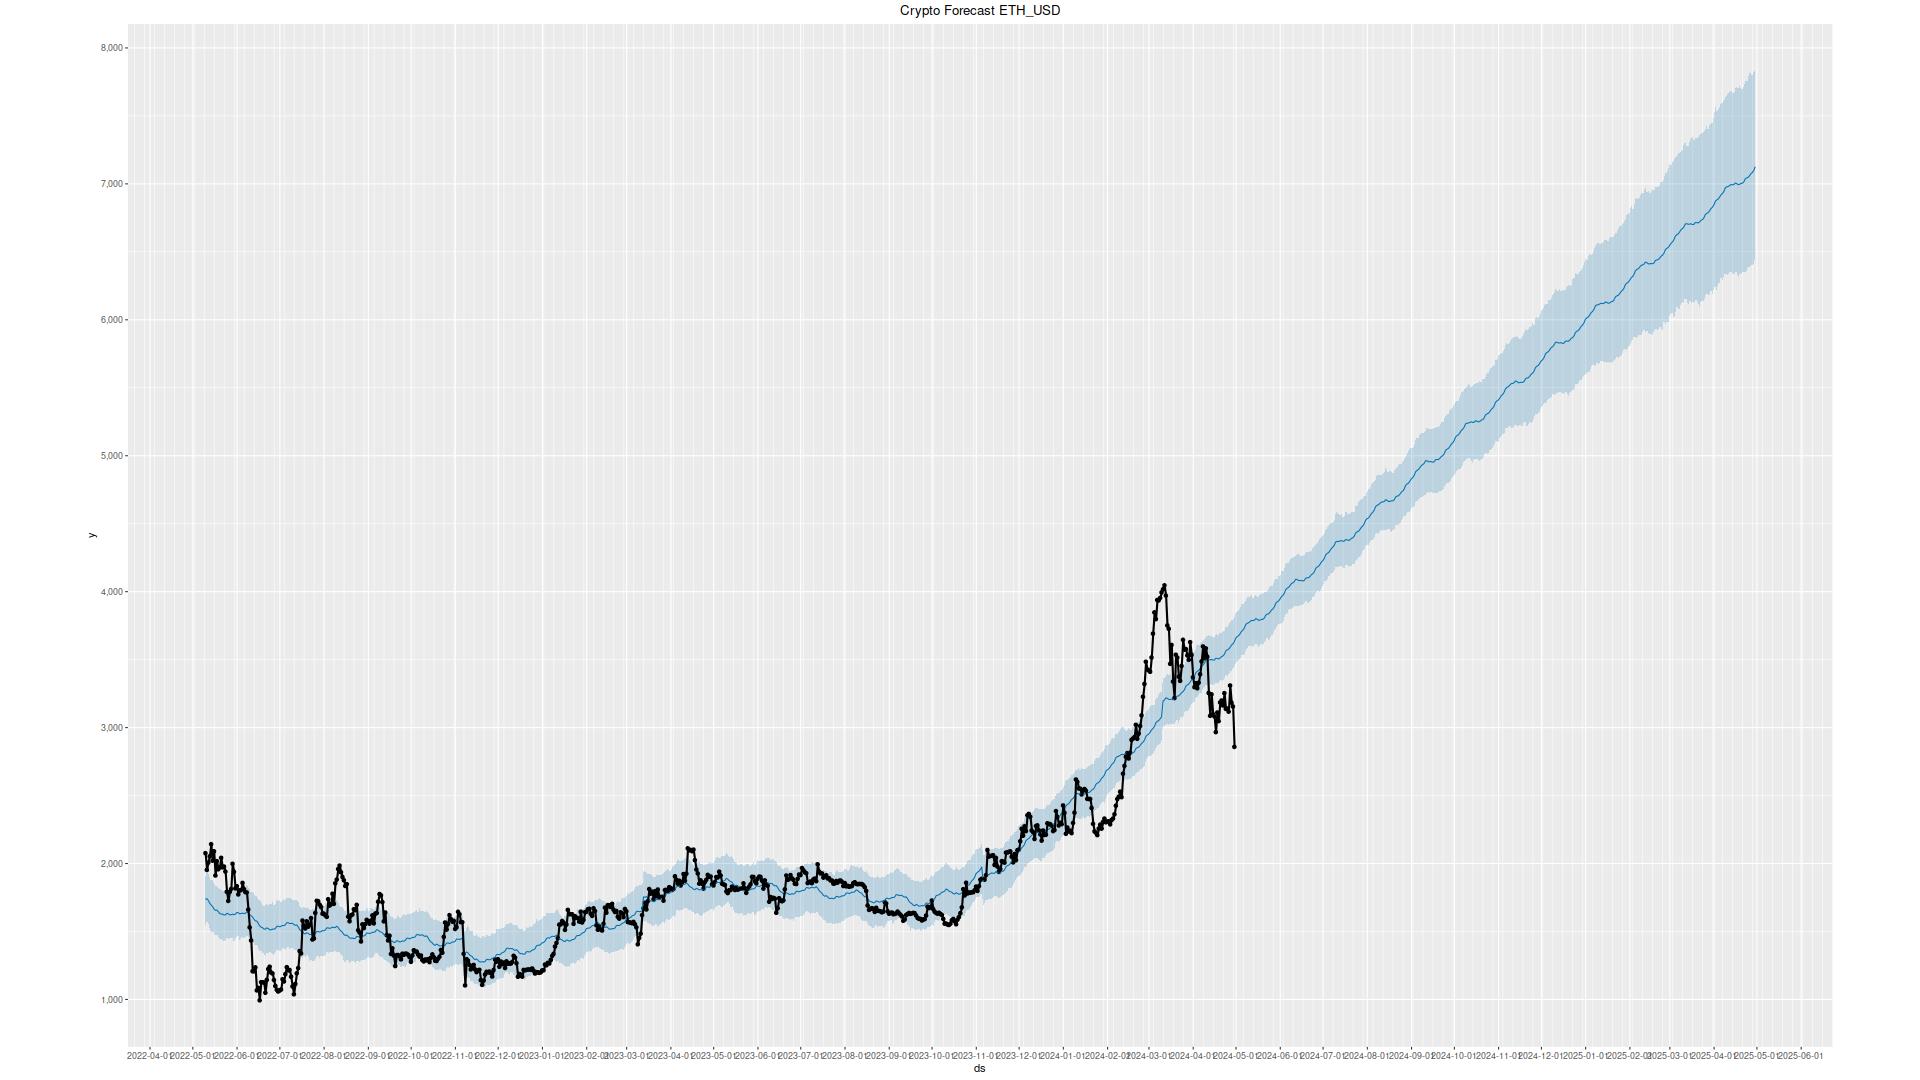
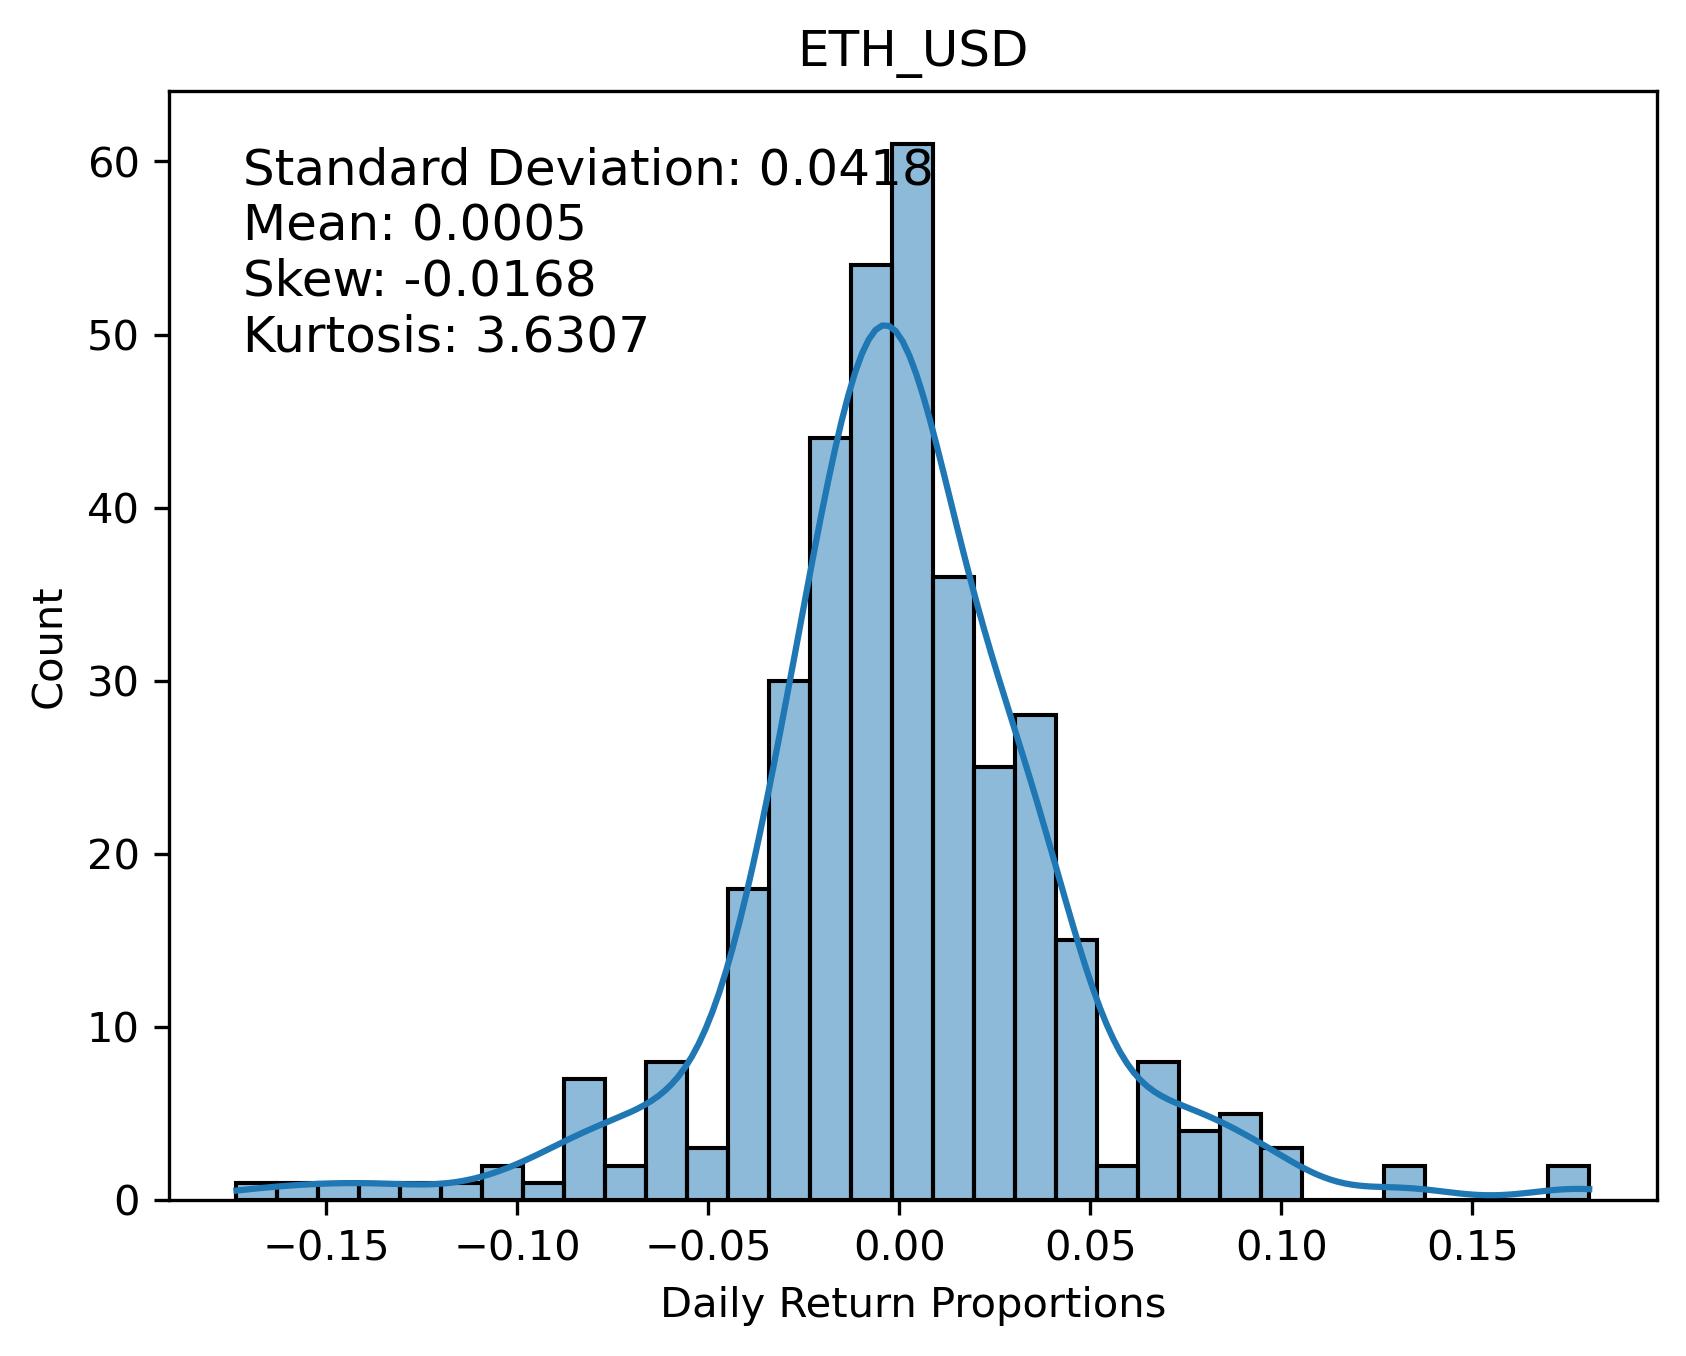
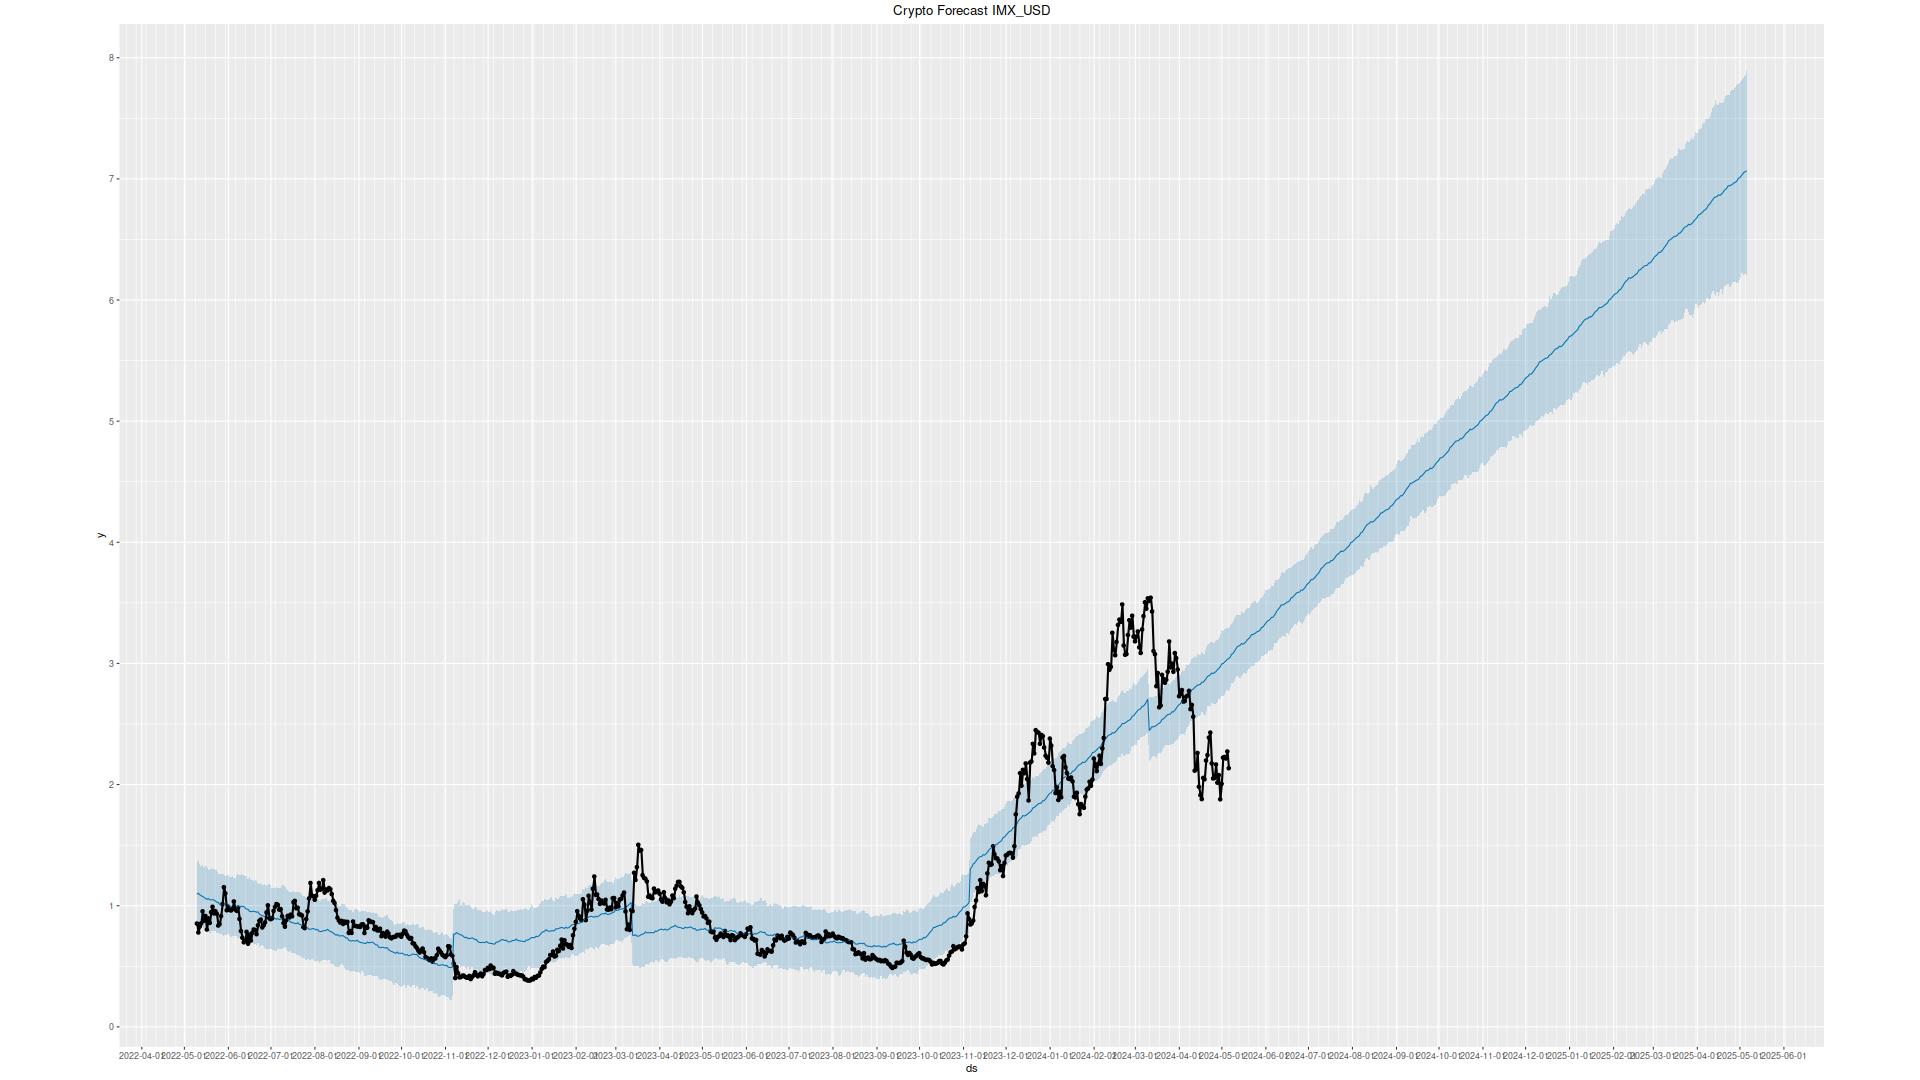
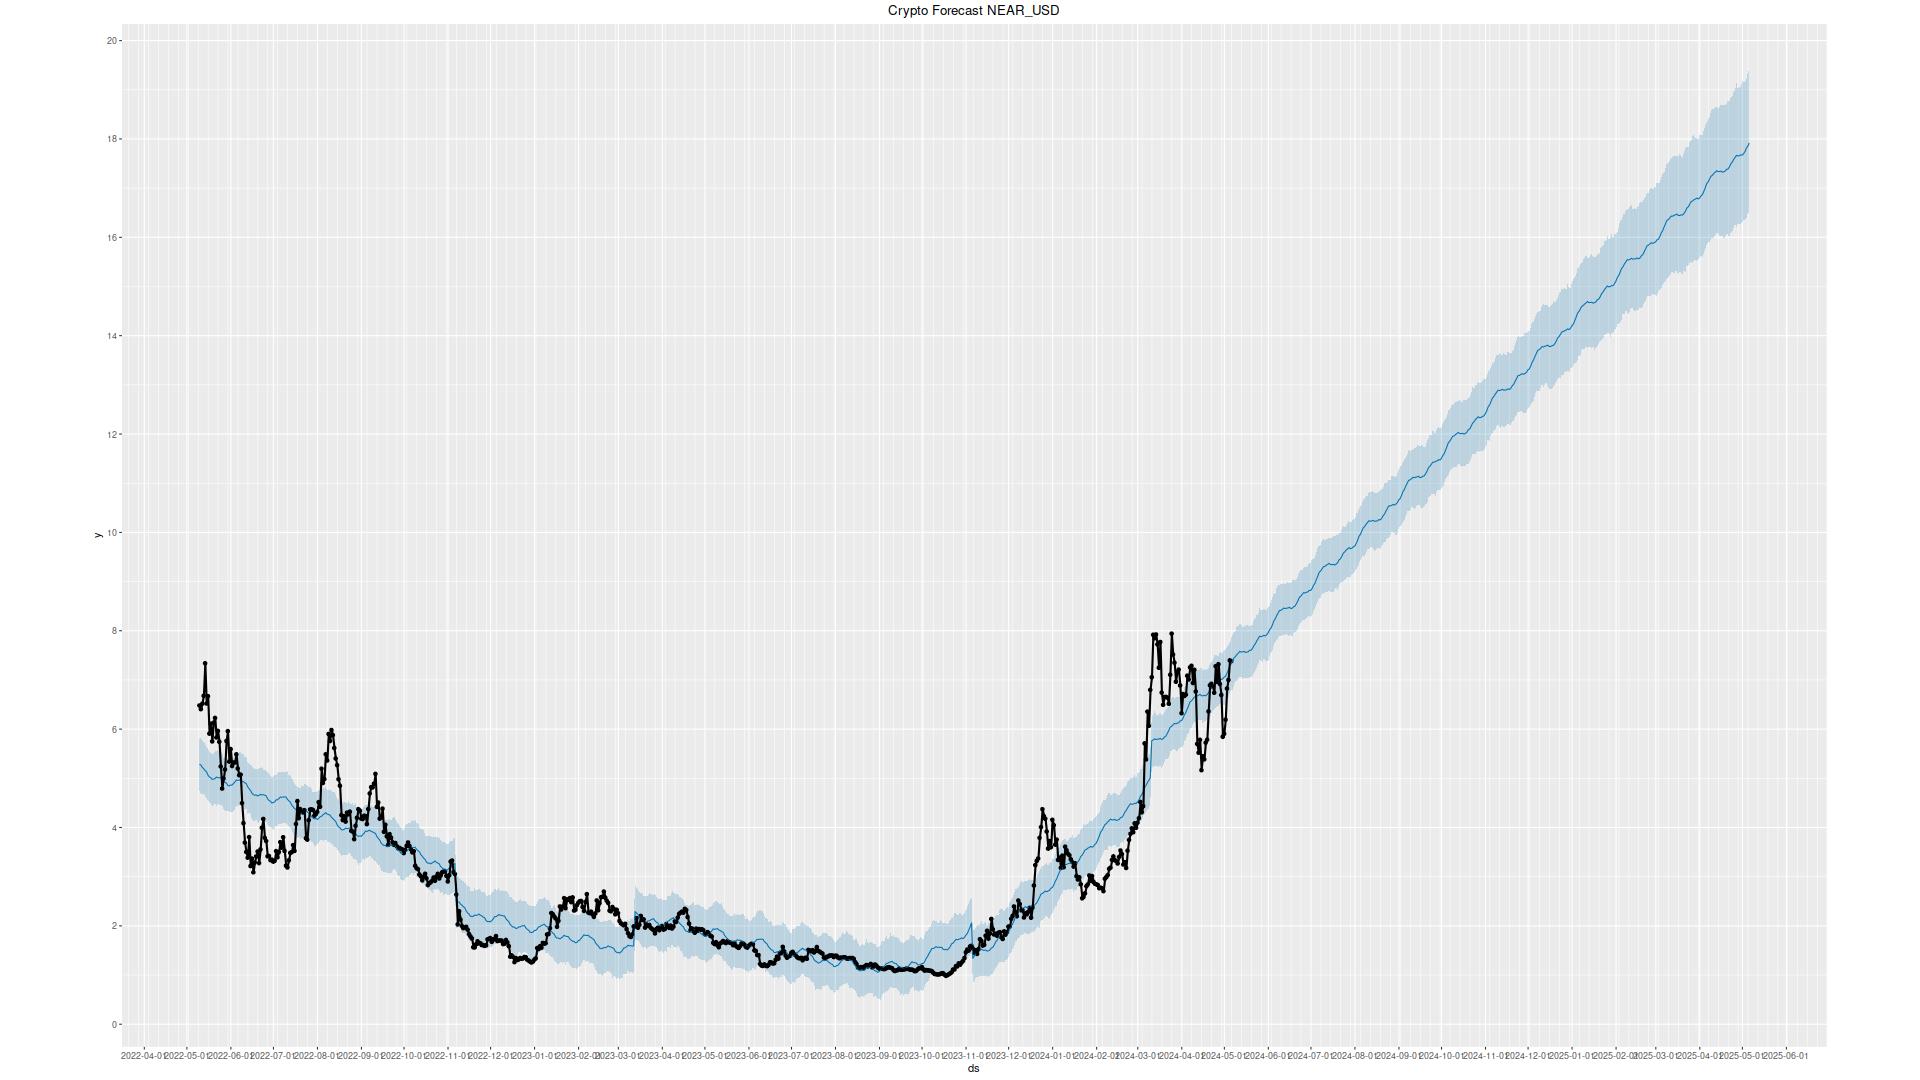
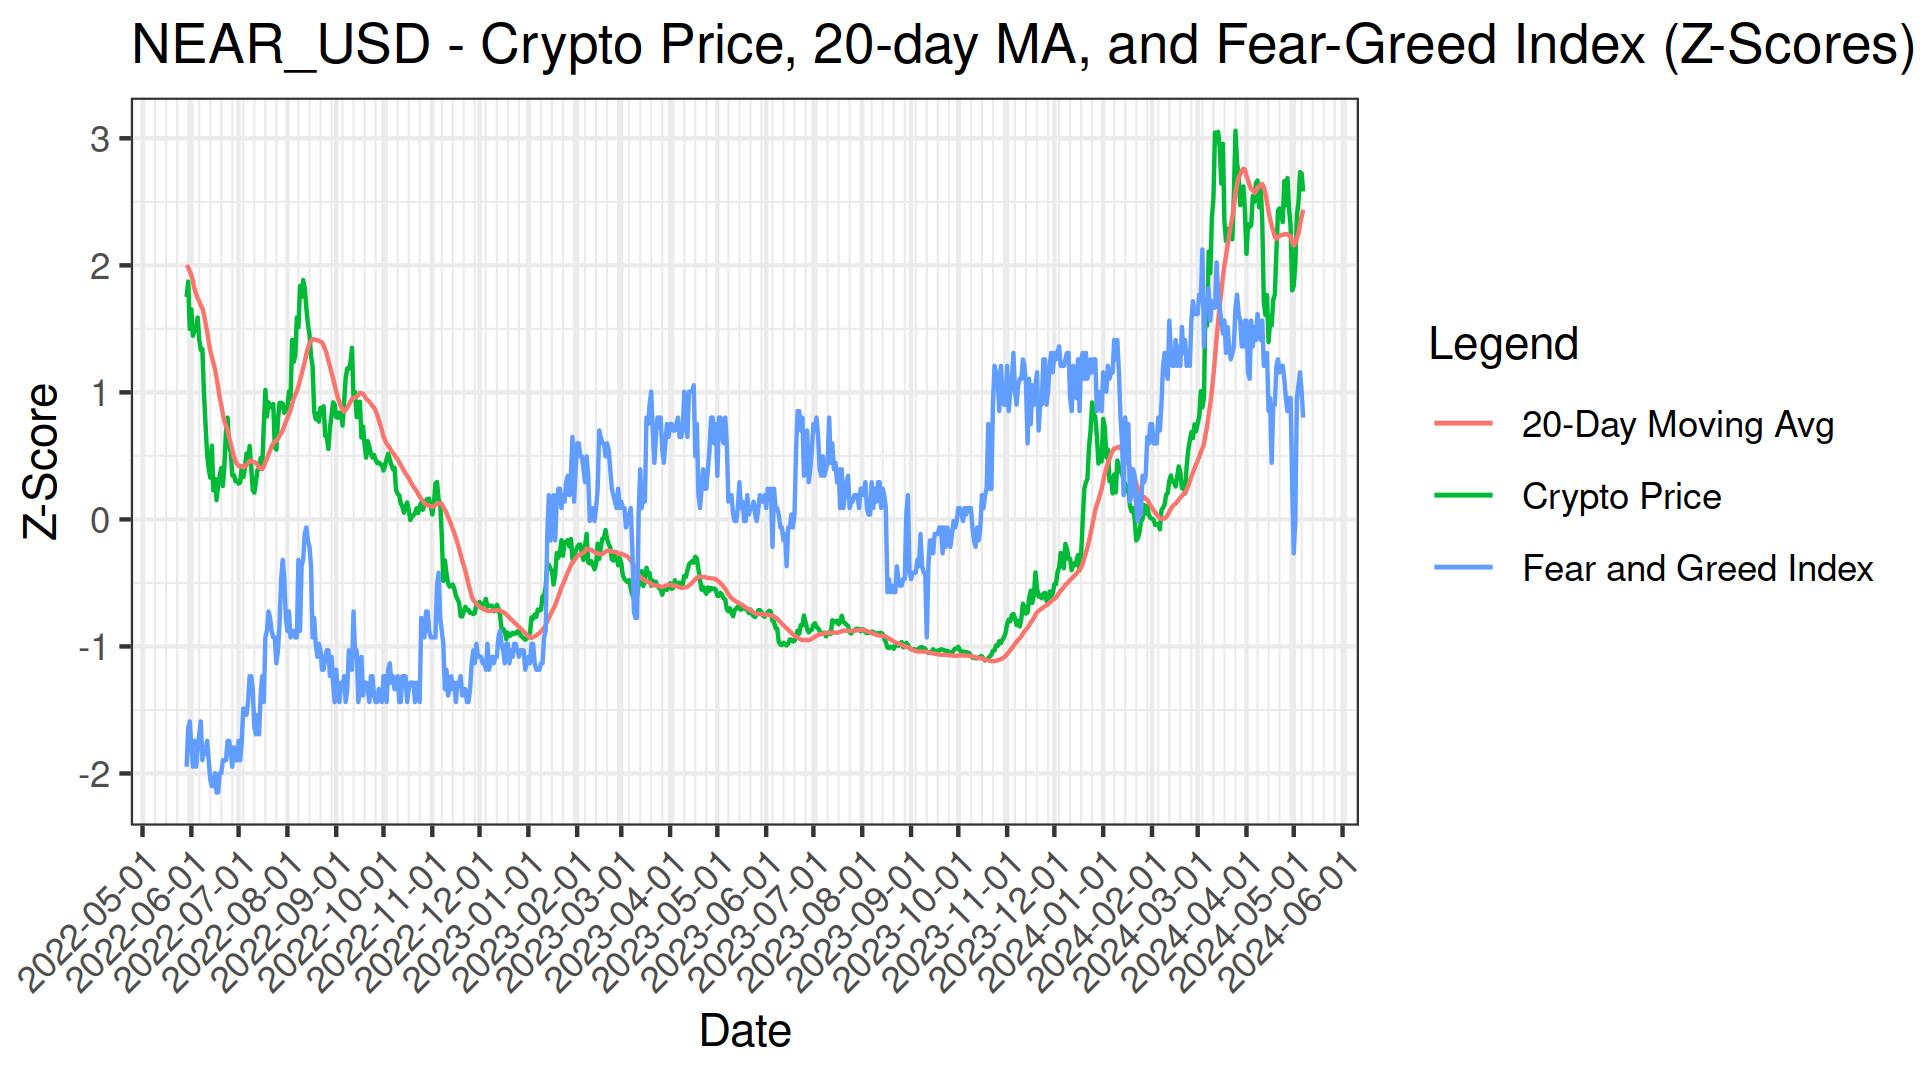
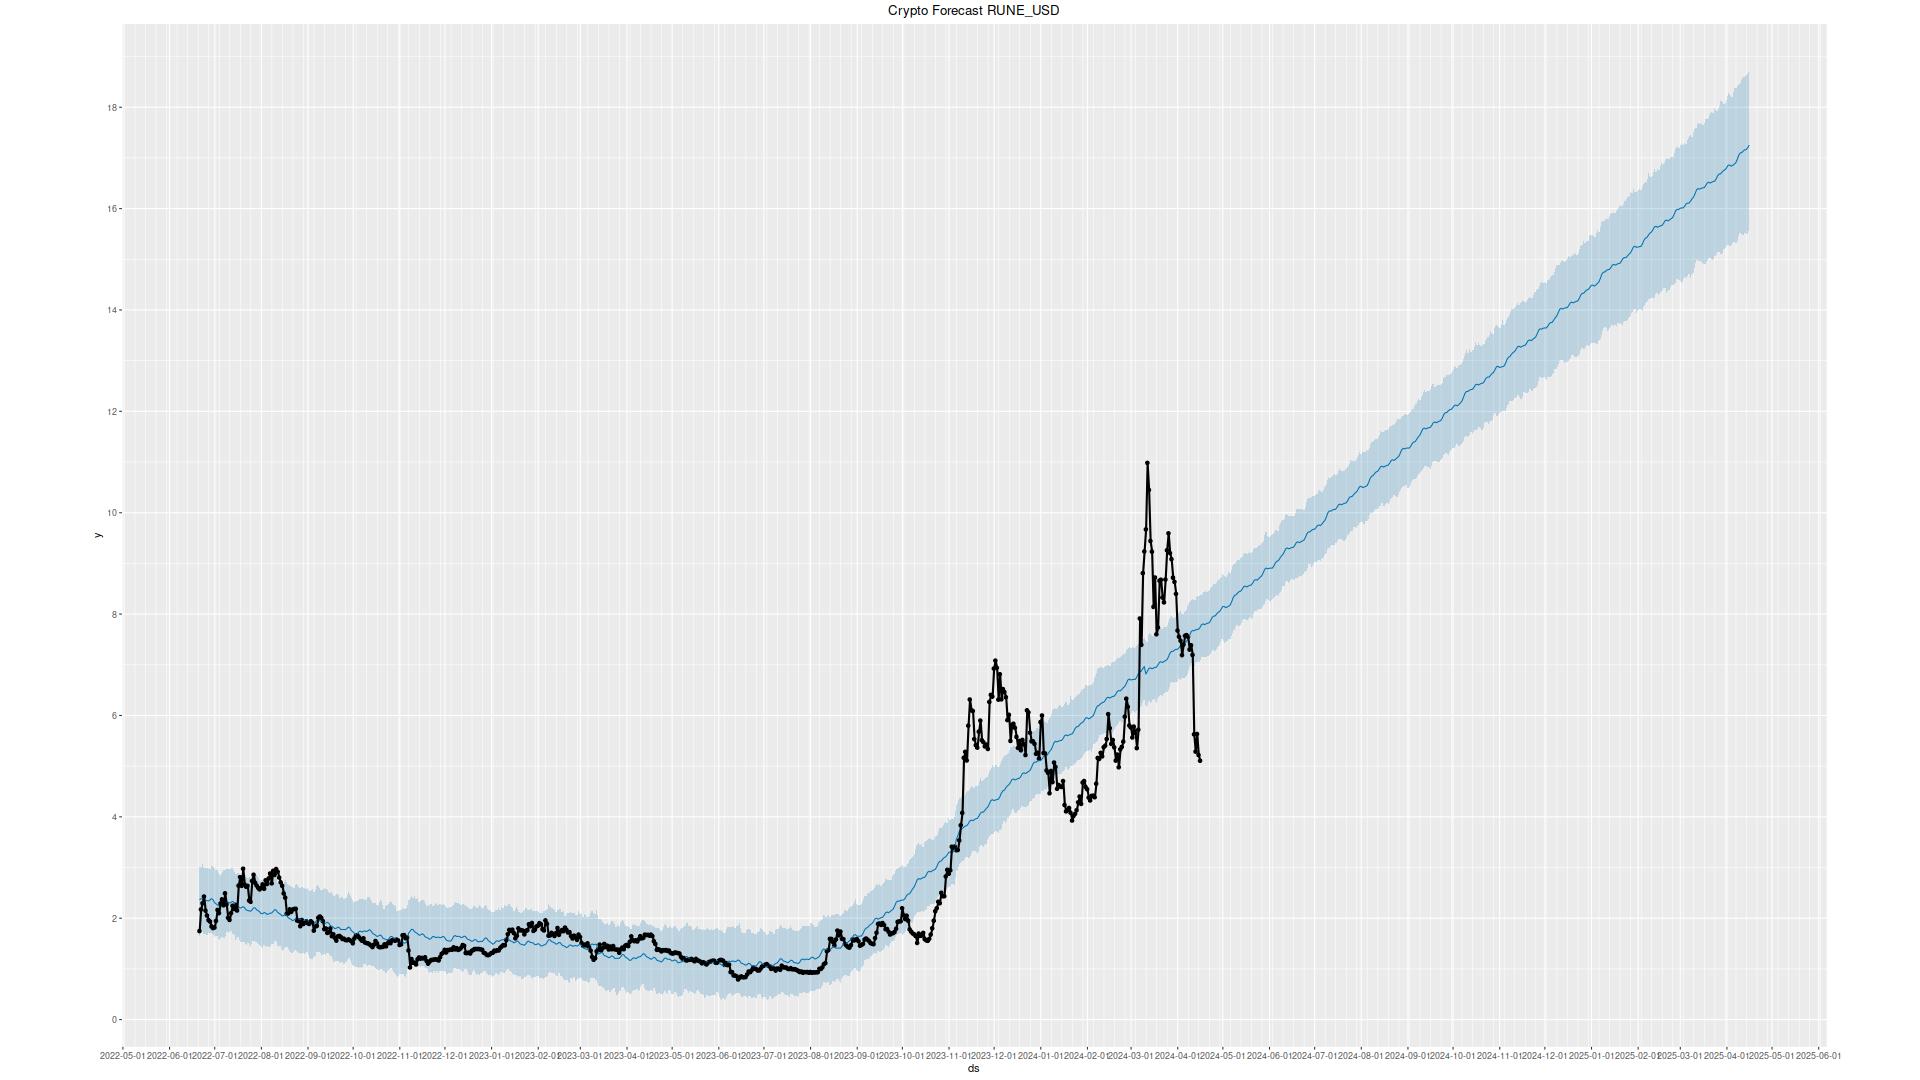
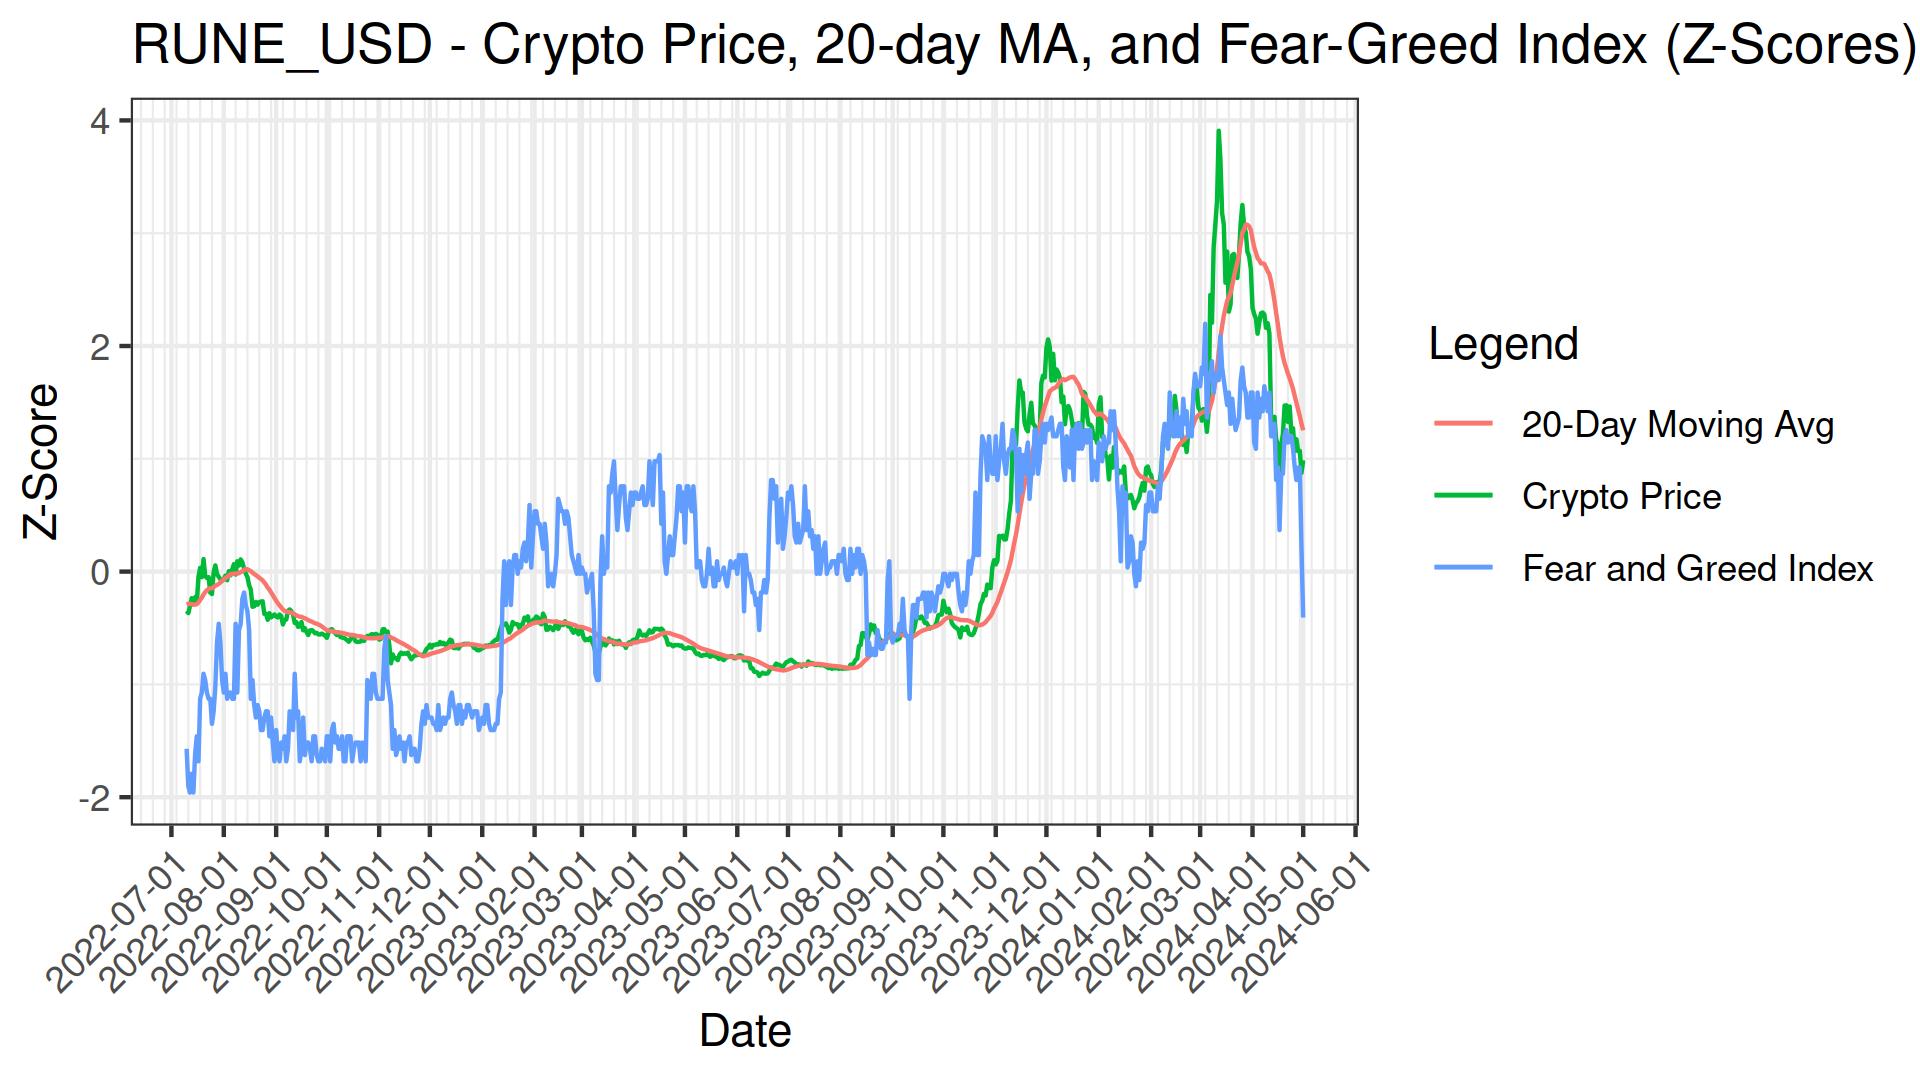
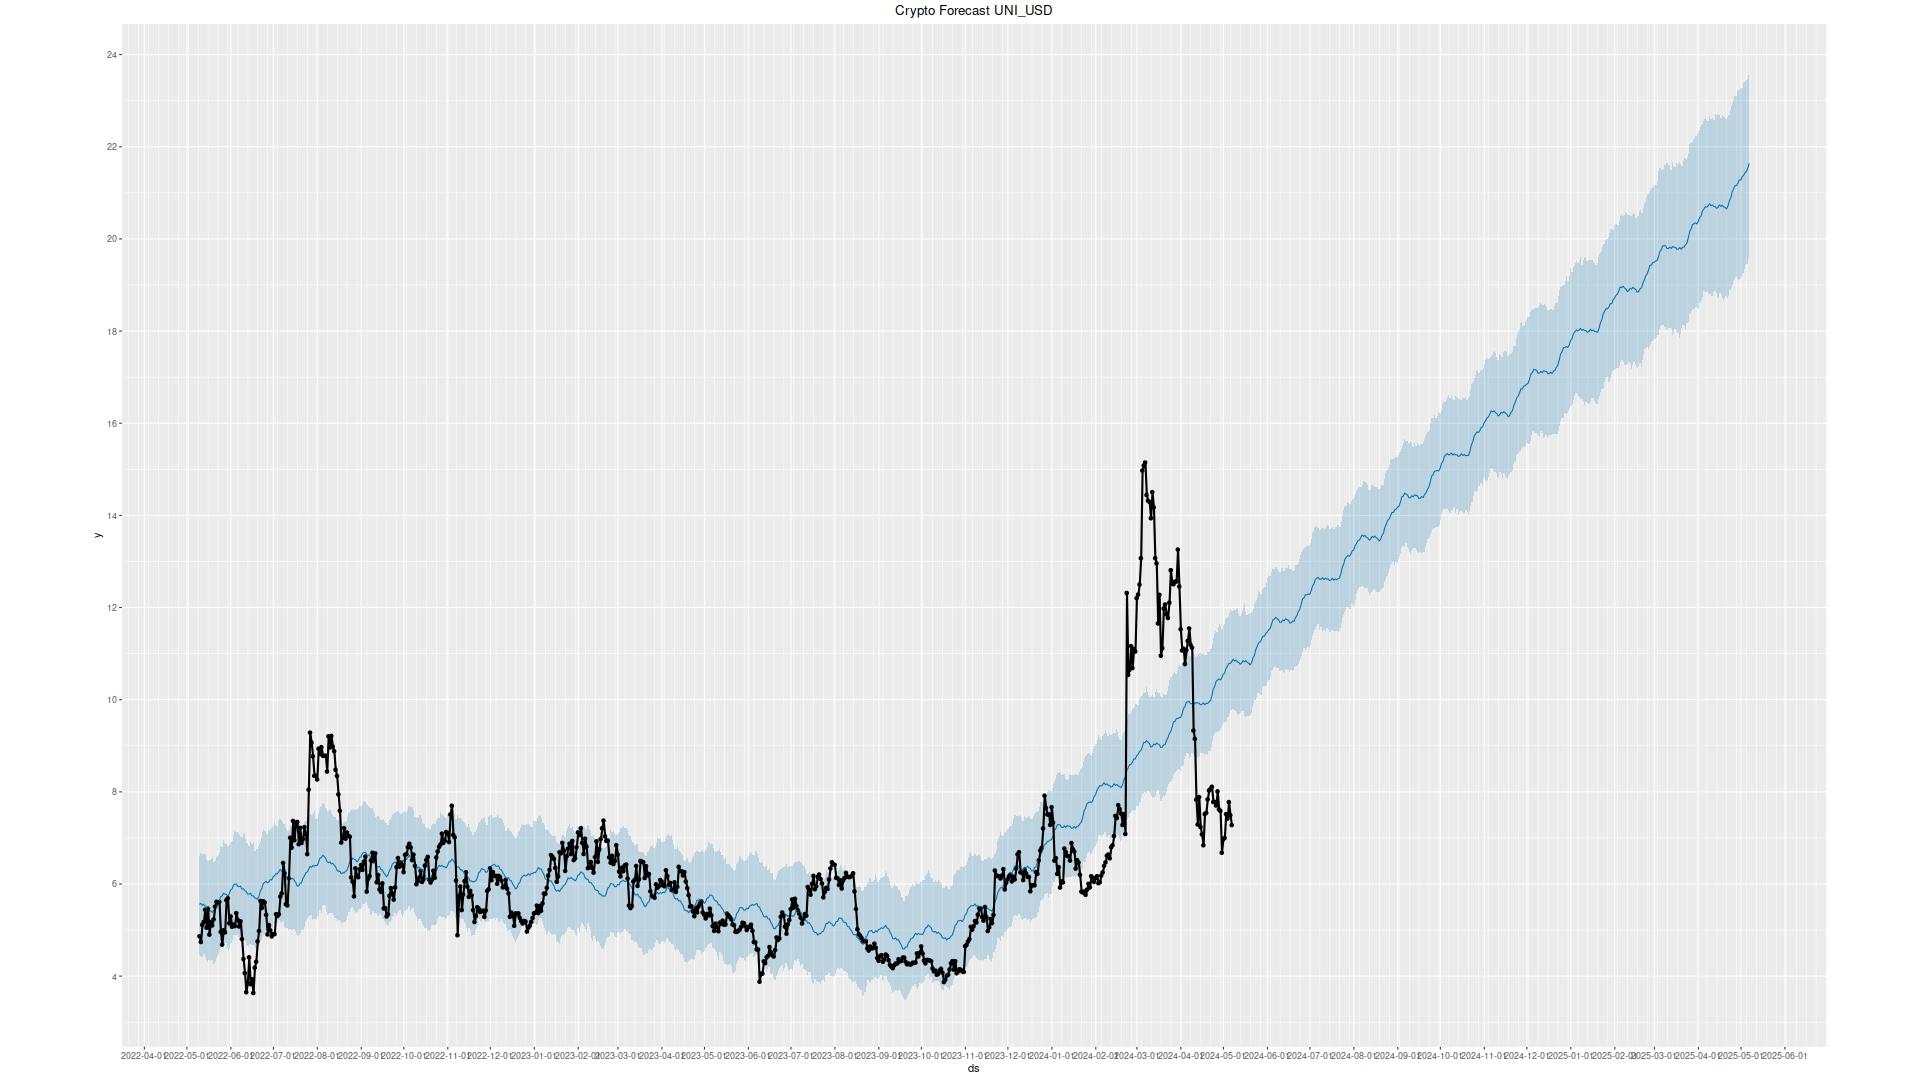
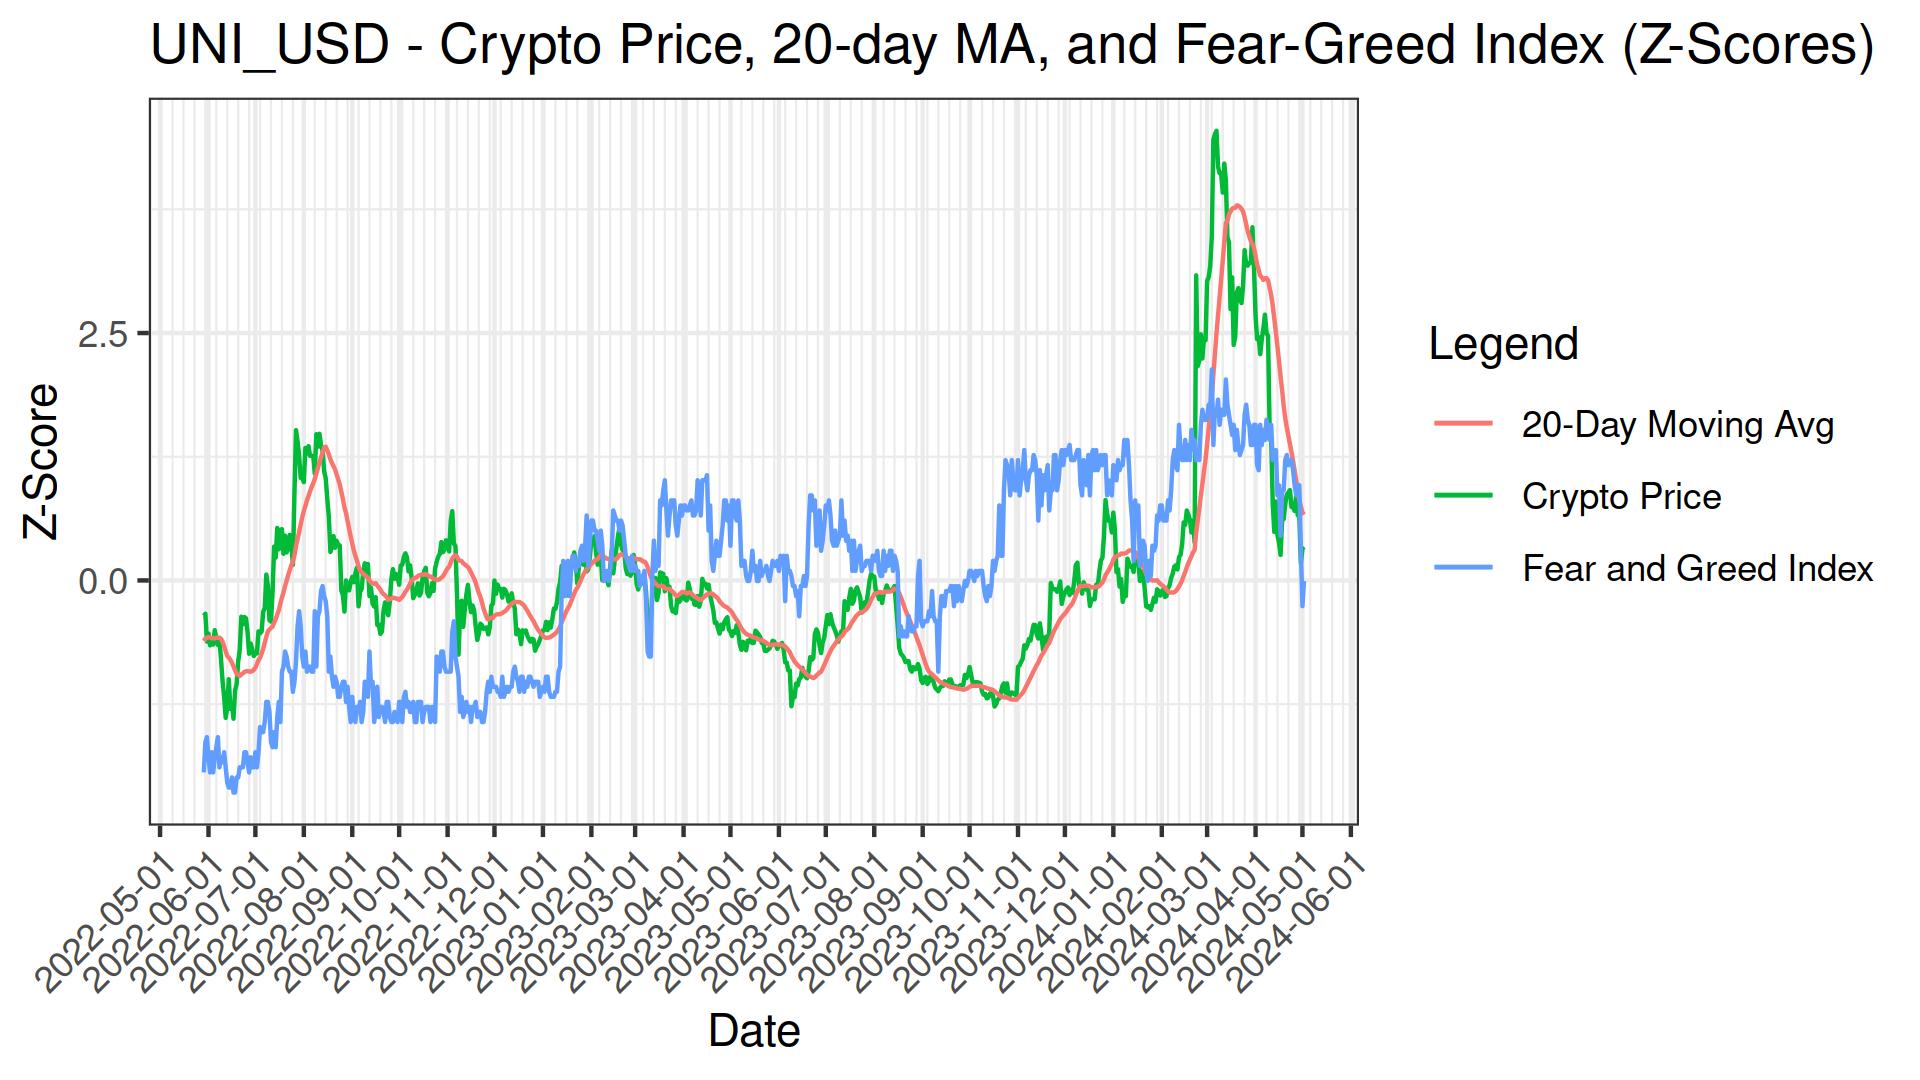
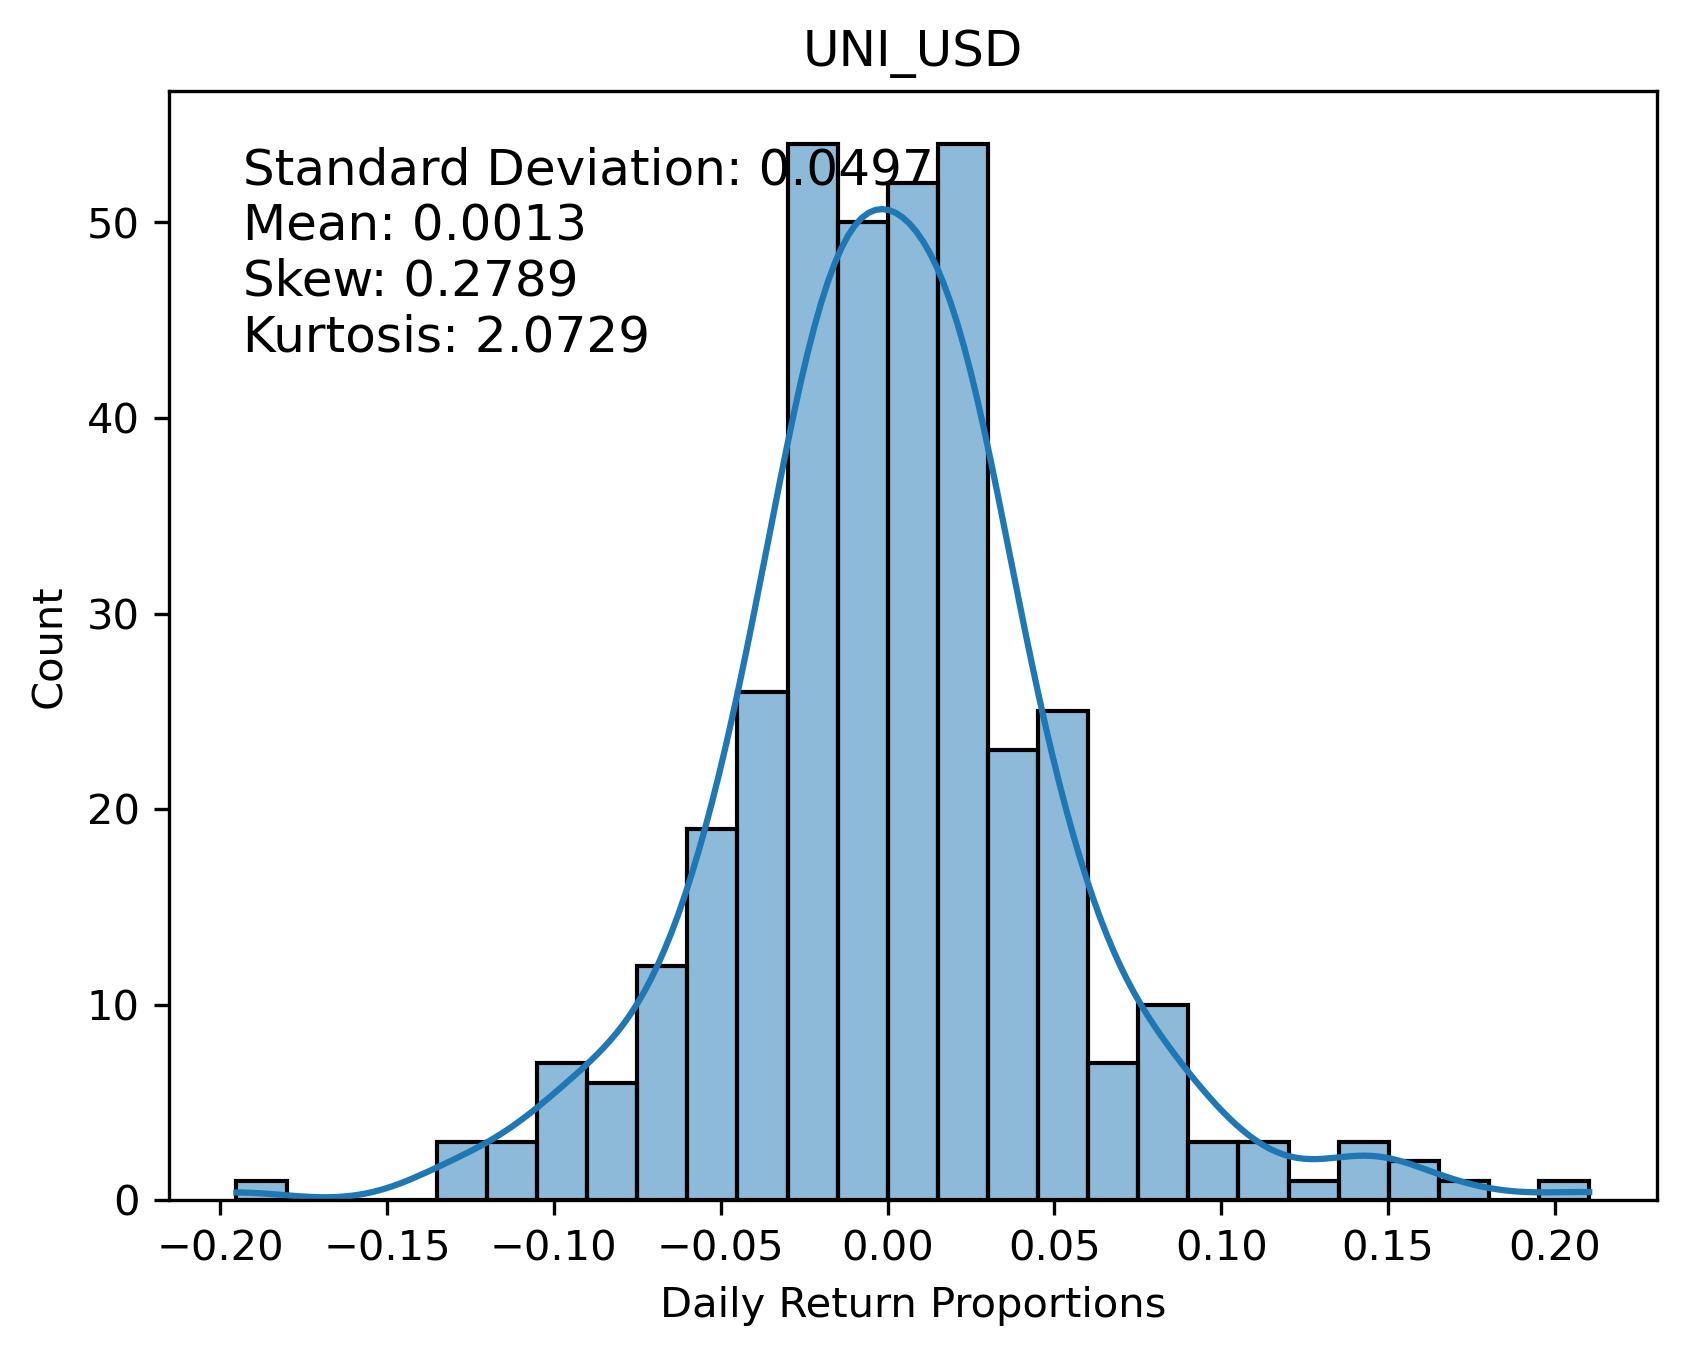
close: $7.27
pearsons cor(100-days): 0.6917
| Return Value | Short MA | Long MA | Buy Date | Sell Date | Latest Action | Sharpe Ratio | Drawdown |
|---|---|---|---|---|---|---|---|
| 179.31% | 13 | 53 | 2024-06-02 | 2024-06-09 | 1.68 | -2.25% | |
| 163.14% | 12 | 54 | 2024-06-04 | 2024-06-09 | 1.40 | -6.53% | |
| 158.46% | 10 | 57 | 2024-06-06 | 2024-06-07 | 1.31 | -6.53% | |
| 157.07% | 10 | 65 | 2024-02-14 | 2024-04-13 | 1.53 | -3.66% | |
| 157.07% | 10 | 66 | 2024-02-14 | 2024-04-13 | 1.53 | -3.66% | |
| 156.80% | 17 | 92 | 2023-10-30 | 2024-04-19 | 0.78 | -2.52% | |
| 156.80% | 18 | 92 | 2023-10-30 | 2024-04-19 | 0.78 | -2.52% |
close: $0.73
pearsons cor(100-days): 0.6409
| Return Value | Short MA | Long MA | Buy Date | Sell Date | Latest Action | Sharpe Ratio | Drawdown |
|---|---|---|---|---|---|---|---|
| 136.93% | 10 | 197 | 2023-12-01 | 2024-04-12 | 1.56 | 0.00% | |
| 133.94% | 10 | 193 | 2023-11-30 | 2024-04-12 | 1.44 | 0.00% | |
| 131.34% | 10 | 198 | 2023-12-01 | 2024-04-12 | 1.34 | 0.00% | |
| 131.34% | 10 | 199 | 2023-12-01 | 2024-04-12 | 1.34 | 0.00% | |
| 131.34% | 10 | 200 | 2023-12-01 | 2024-04-12 | 1.34 | 0.00% | |
| 129.18% | 10 | 196 | 2023-12-01 | 2024-04-12 | 1.27 | 0.00% | |
| 129.18% | 10 | 194 | 2023-12-01 | 2024-04-12 | 1.27 | 0.00% |
close: $6.29
pearsons cor(100-days): 0.5716
| Return Value | Short MA | Long MA | Buy Date | Sell Date | Latest Action | Sharpe Ratio | Drawdown |
|---|---|---|---|---|---|---|---|
| 240.10% | 17 | 67 | 2024-02-23 | 2024-04-12 | 1.91 | -1.16% | |
| 230.99% | 17 | 68 | 2024-02-24 | 2024-04-12 | 1.82 | -1.90% | |
| 208.95% | 17 | 66 | 2024-02-23 | 2024-04-11 | 1.70 | -1.16% | |
| 197.35% | 17 | 69 | 2024-02-24 | 2024-04-12 | 1.43 | -8.05% | |
| 173.67% | 15 | 70 | 2024-02-23 | 2024-04-12 | 1.93 | 0.00% | |
| 172.16% | 14 | 72 | 2024-02-23 | 2024-04-12 | 1.73 | -2.02% | |
| 169.99% | 12 | 72 | 2024-02-23 | 2024-04-10 | 1.77 | -1.34% |
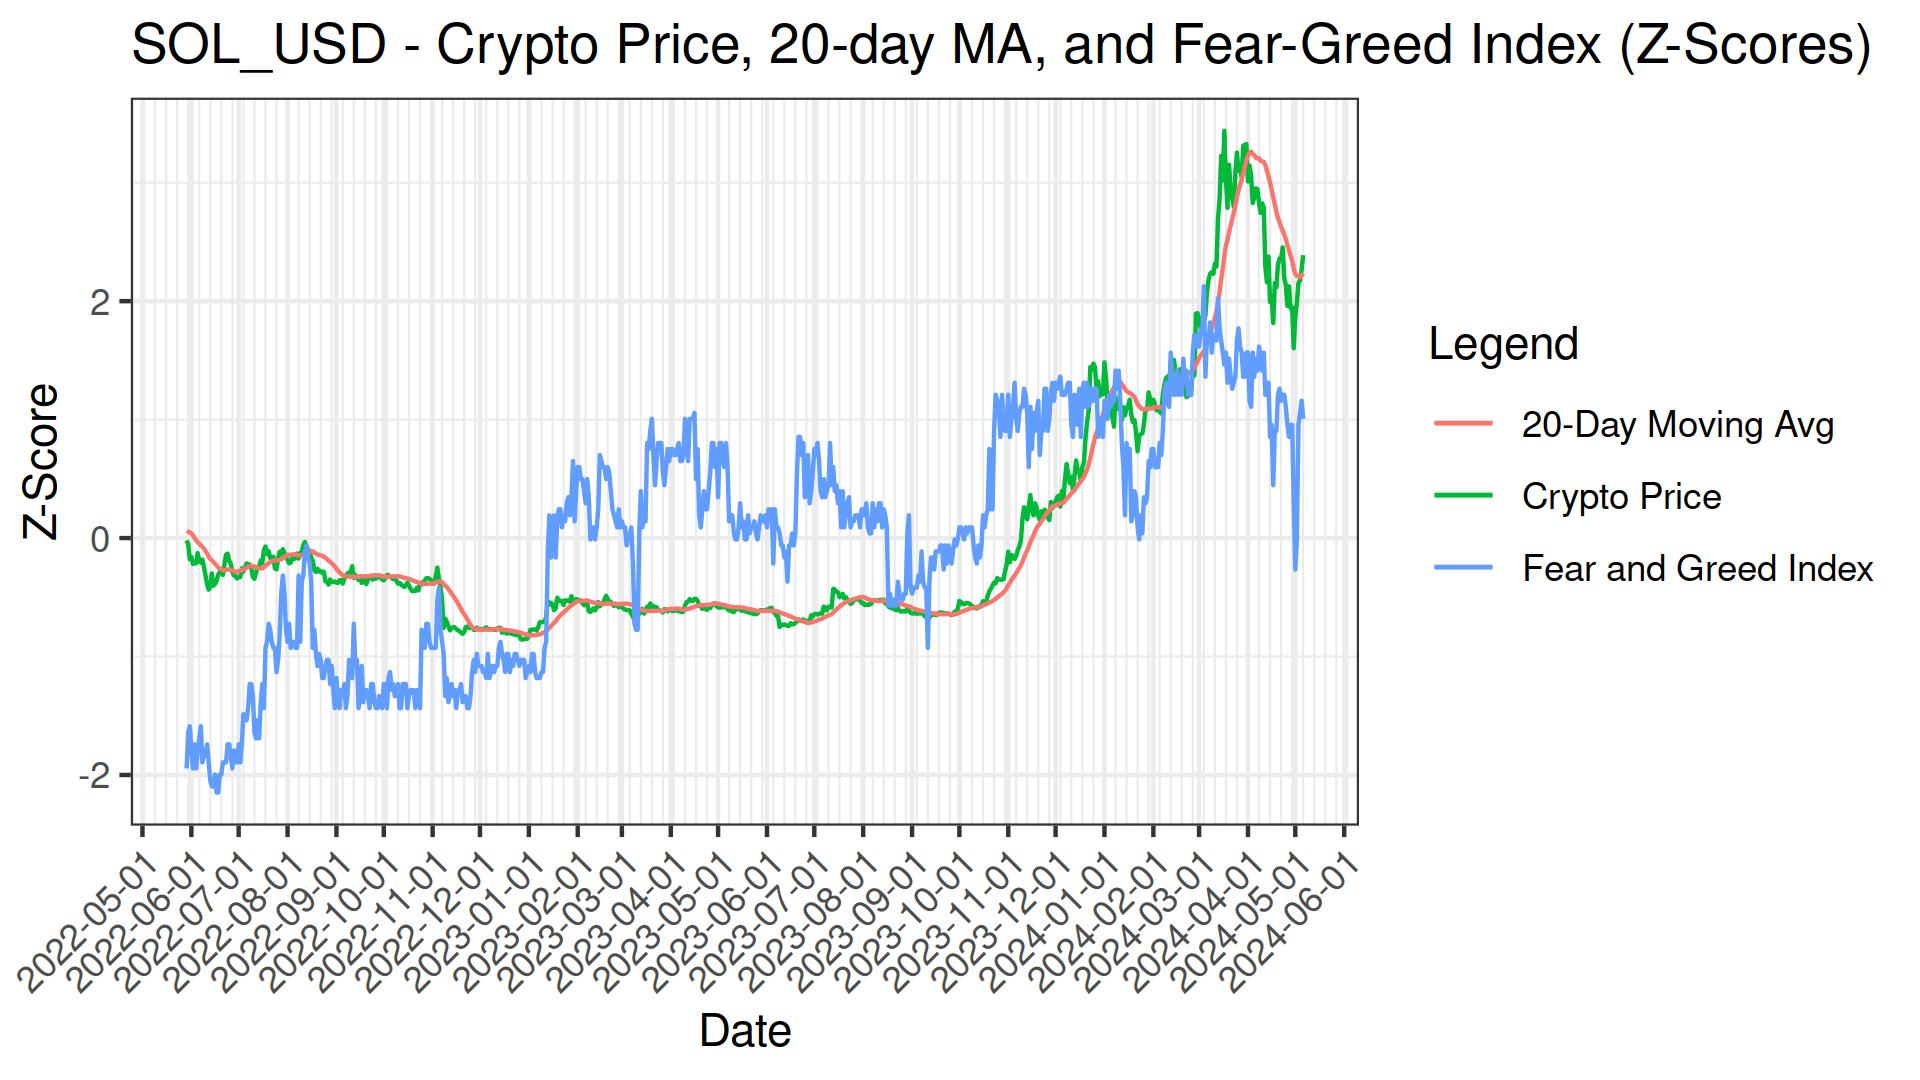
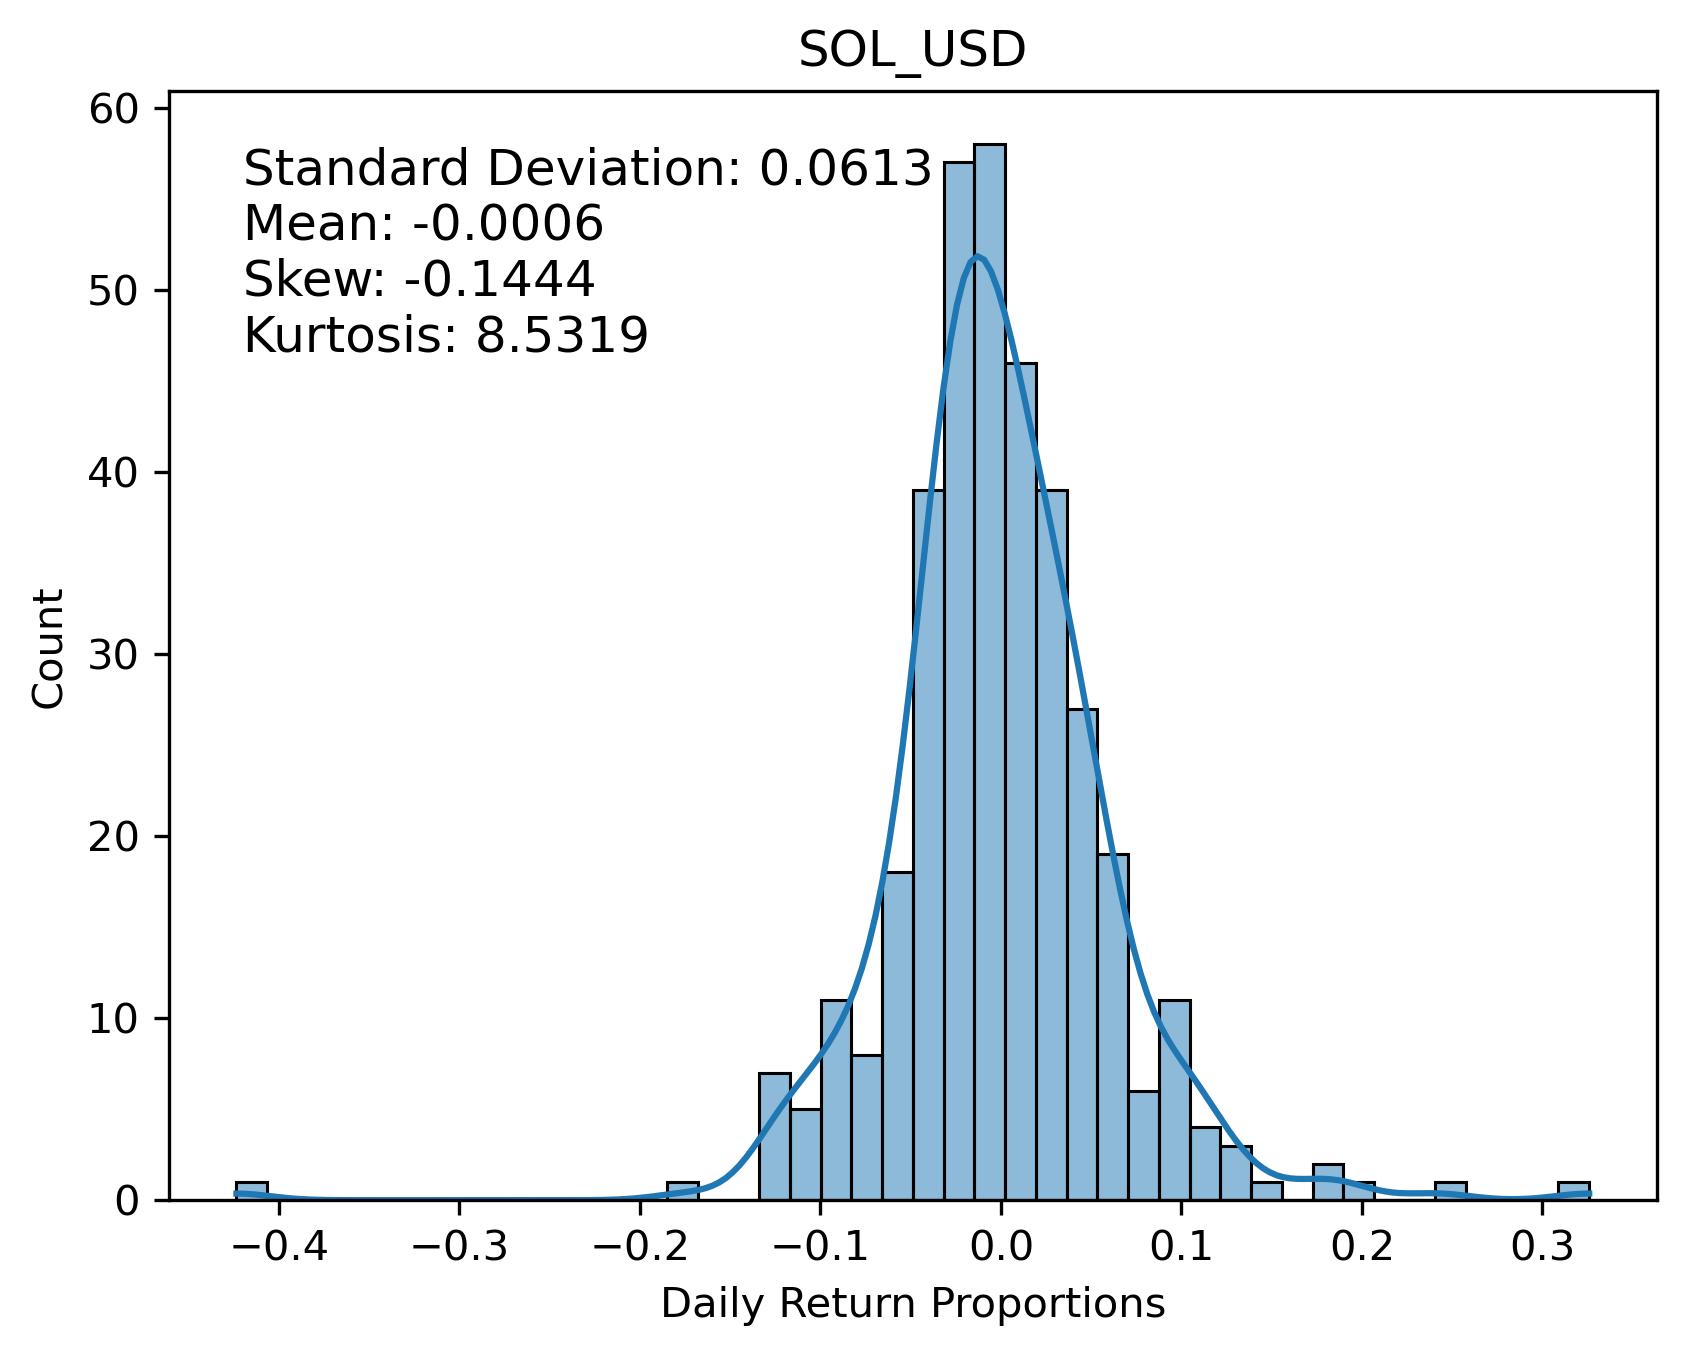
close: $28.71
pearsons cor(100-days): 0.6689
| Return Value | Short MA | Long MA | Buy Date | Sell Date | Latest Action | Sharpe Ratio | Drawdown |
|---|---|---|---|---|---|---|---|
| 220.43% | 12 | 59 | 2024-05-31 | 2024-06-01 | 1.95 | -3.88% | |
| 217.01% | 12 | 58 | 2024-05-31 | 2024-06-01 | 1.90 | -3.88% | |
| 214.71% | 13 | 57 | 2024-06-05 | 2024-06-07 | 1.96 | -4.59% | |
| 203.58% | 13 | 58 | 2024-05-31 | 2024-06-03 | 2.14 | -0.36% | |
| 200.23% | 12 | 60 | 2024-02-14 | 2024-04-12 | 1.97 | -3.64% | |
| 185.37% | 13 | 56 | 2024-05-28 | 2024-06-07 | 1.51 | -5.39% | |
| 183.04% | 12 | 56 | 2024-06-04 | 2024-06-07 | 1.54 | -4.59% |
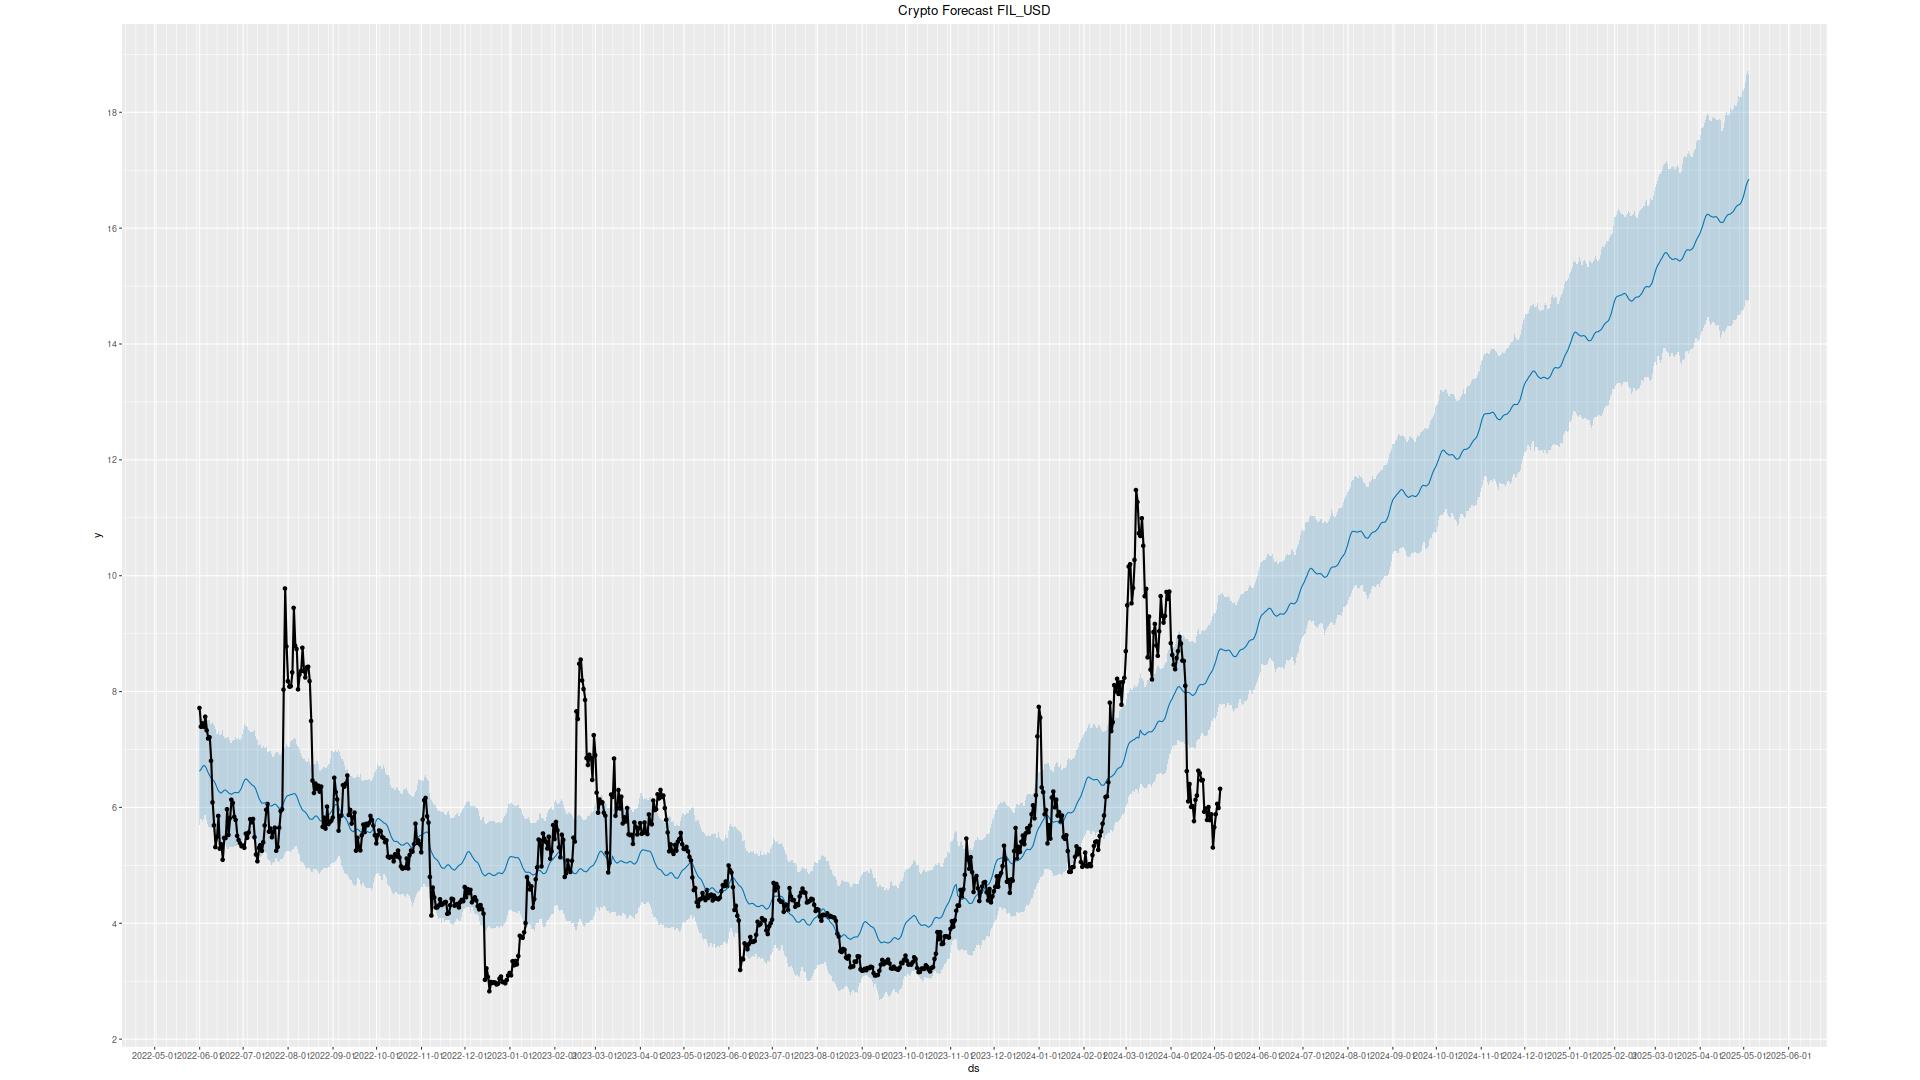
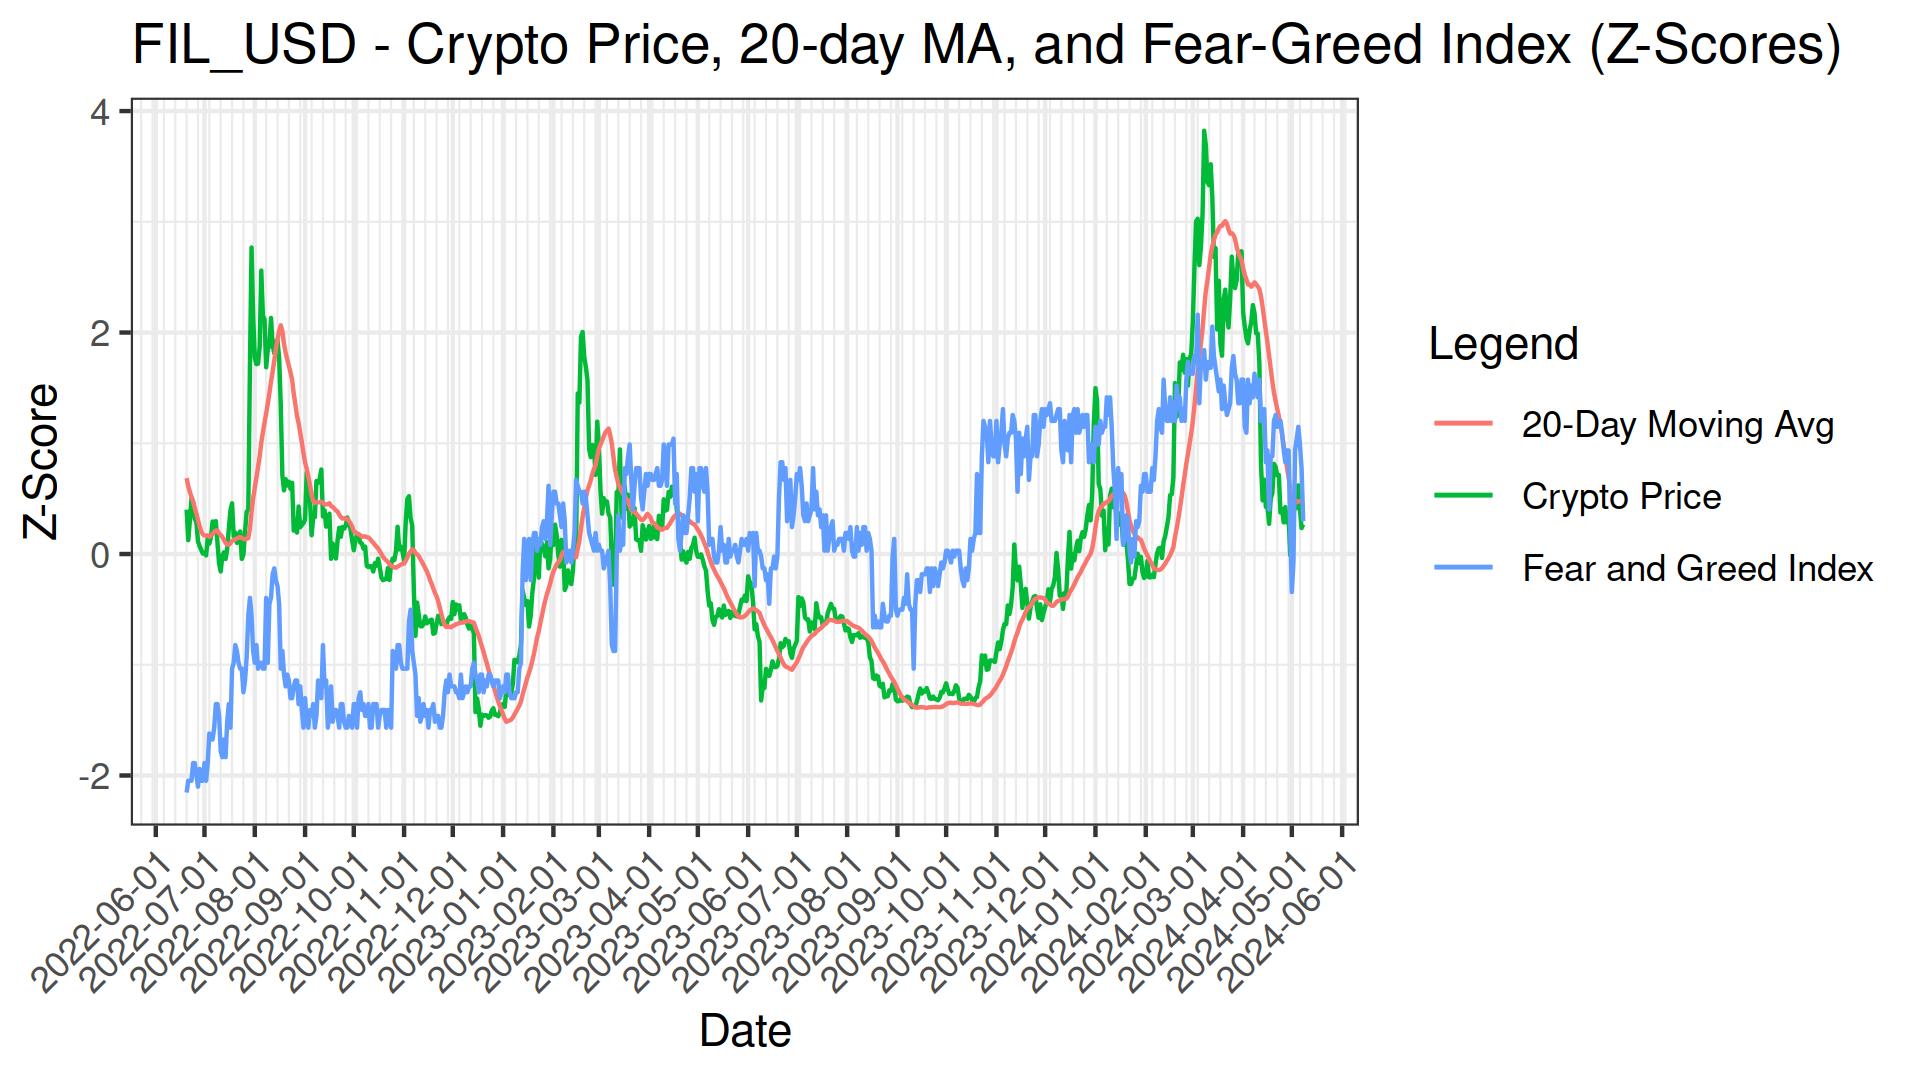
close: $6.10
pearsons cor(100-days): 0.7142

| Return Value | Short MA | Long MA | Buy Date | Sell Date | Latest Action | Sharpe Ratio | Drawdown |
|---|---|---|---|---|---|---|---|
| 204.36% | 14 | 64 | 2024-06-04 | 2024-06-17 | 1.93 | -0.31% | |
| 186.79% | 15 | 61 | 2024-06-02 | 2024-06-17 | 1.70 | -1.15% | |
| 184.11% | 13 | 66 | 2024-06-05 | 2024-06-16 | 1.61 | -1.52% | |
| 180.26% | 13 | 64 | 2024-06-04 | 2024-06-16 | 1.75 | -1.07% | |
| 179.68% | 15 | 60 | 2024-06-02 | 2024-06-17 | 1.83 | -0.31% | |
| 180.73% | 15 | 62 | 2024-06-03 | 2024-06-17 | 1.59 | -3.79% | |
| 179.14% | 14 | 61 | 2024-06-02 | 2024-06-17 | 1.82 | -0.31% |
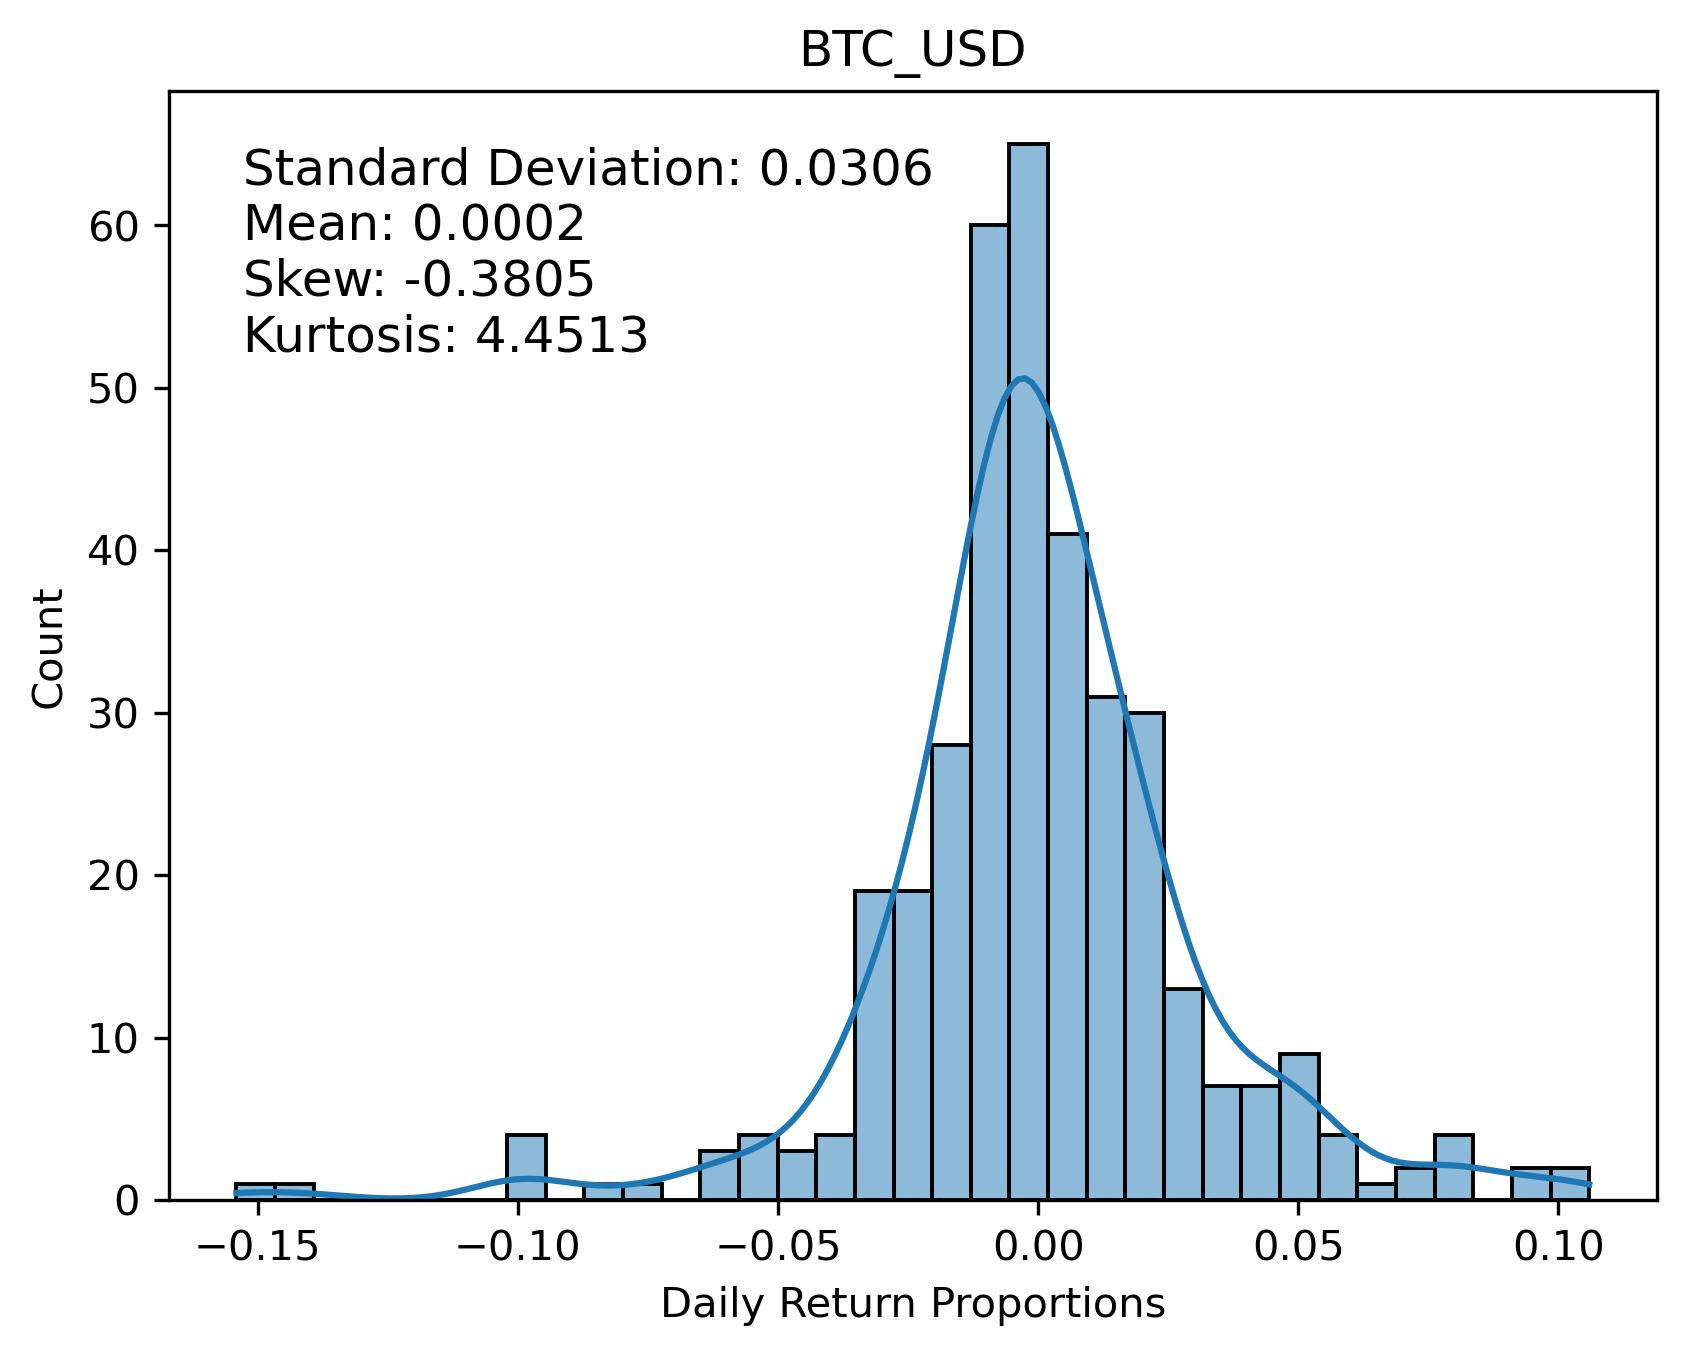
close: $68.09K
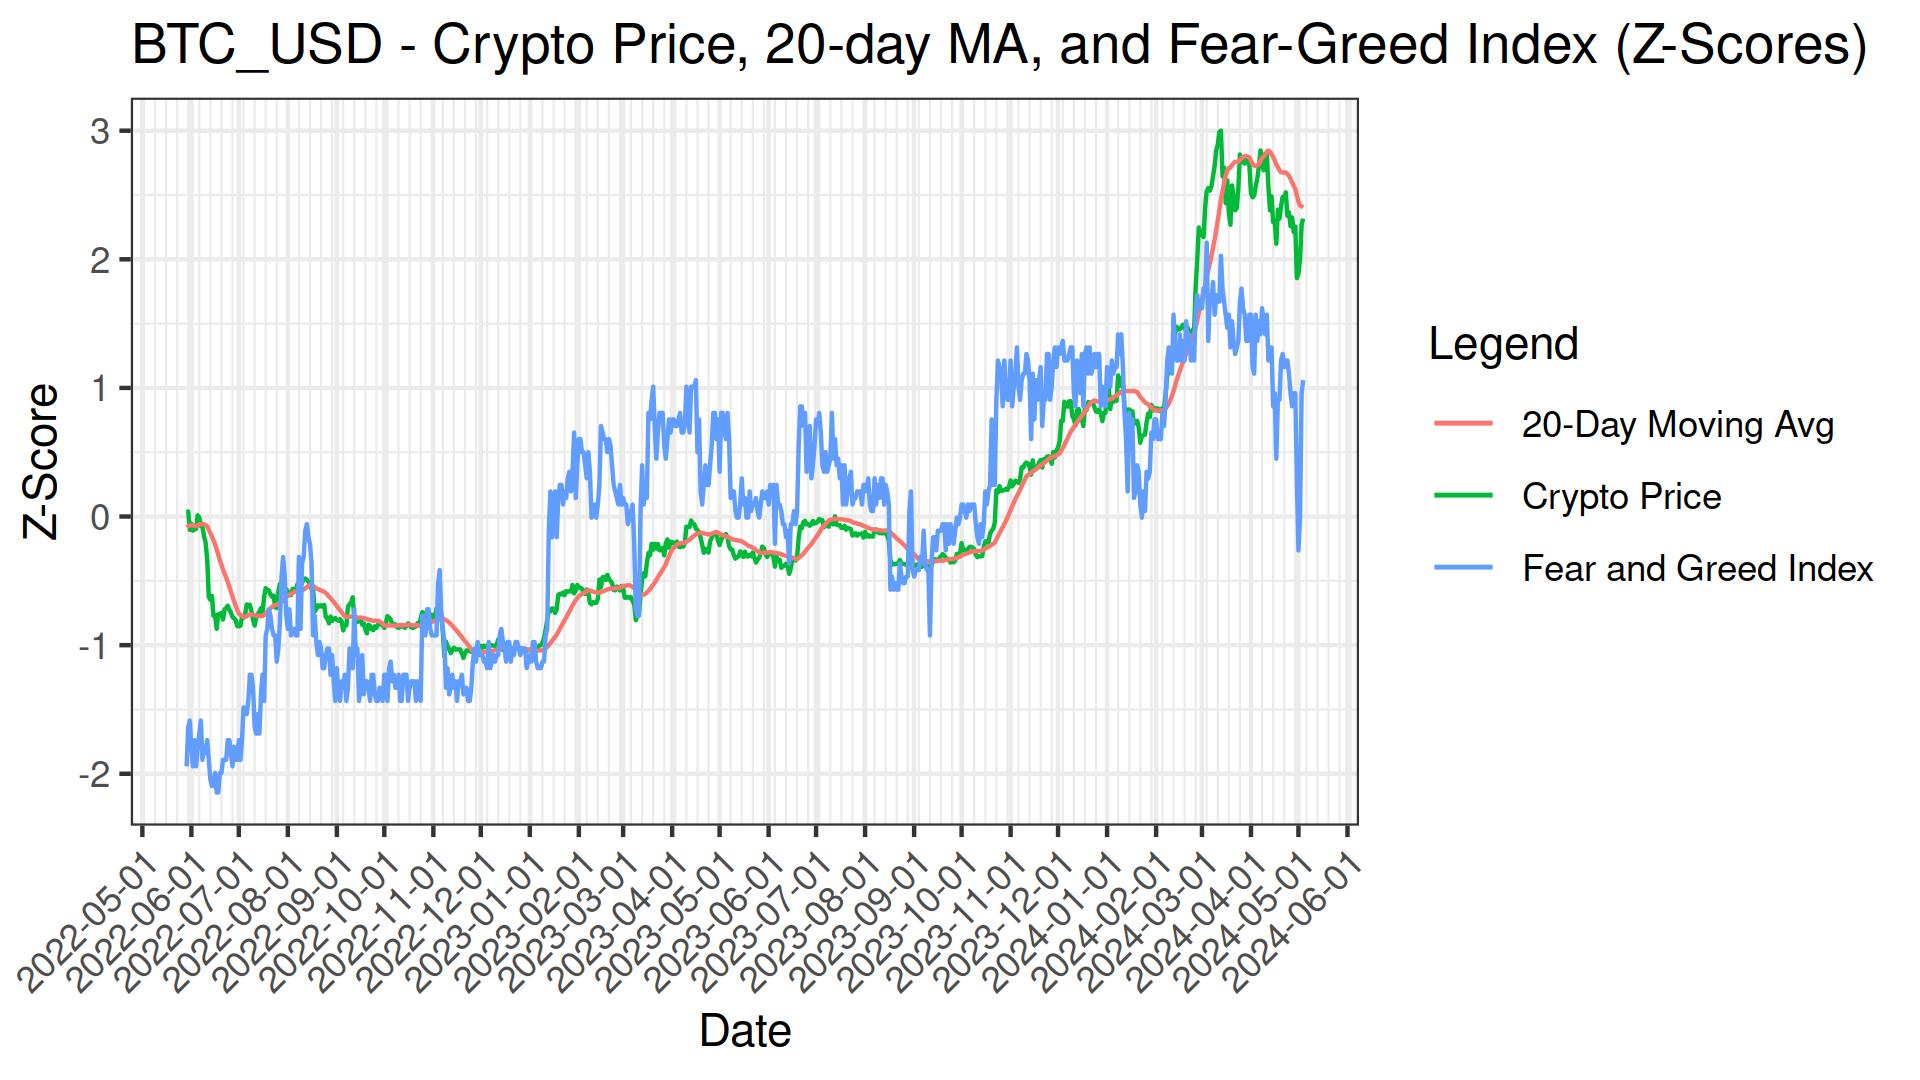
pearsons cor(100-days): 0.8450
| Return Value | Short MA | Long MA | Buy Date | Sell Date | Latest Action | Sharpe Ratio | Drawdown |
|---|---|---|---|---|---|---|---|
| 143.90% | 17 | 53 | 2024-07-26 | 2024-06-24 | buy now | 2.09 | -1.26% |
| 142.15% | 18 | 50 | 2024-07-26 | 2024-06-24 | buy now | 1.90 | -3.09% |
| 139.97% | 11 | 94 | 2024-07-23 | 2024-06-20 | 1.44 | -0.62% | |
| 139.58% | 14 | 53 | 2024-07-25 | 2024-06-23 | 2.19 | -0.96% | |
| 138.67% | 10 | 93 | 2024-07-22 | 2024-06-20 | 1.35 | -1.47% | |
| 138.80% | 10 | 53 | 2024-07-22 | 2024-06-21 | 1.71 | -2.80% | |
| 138.80% | 17 | 50 | 2024-07-26 | 2024-06-23 | buy now | 1.69 | -3.91% |
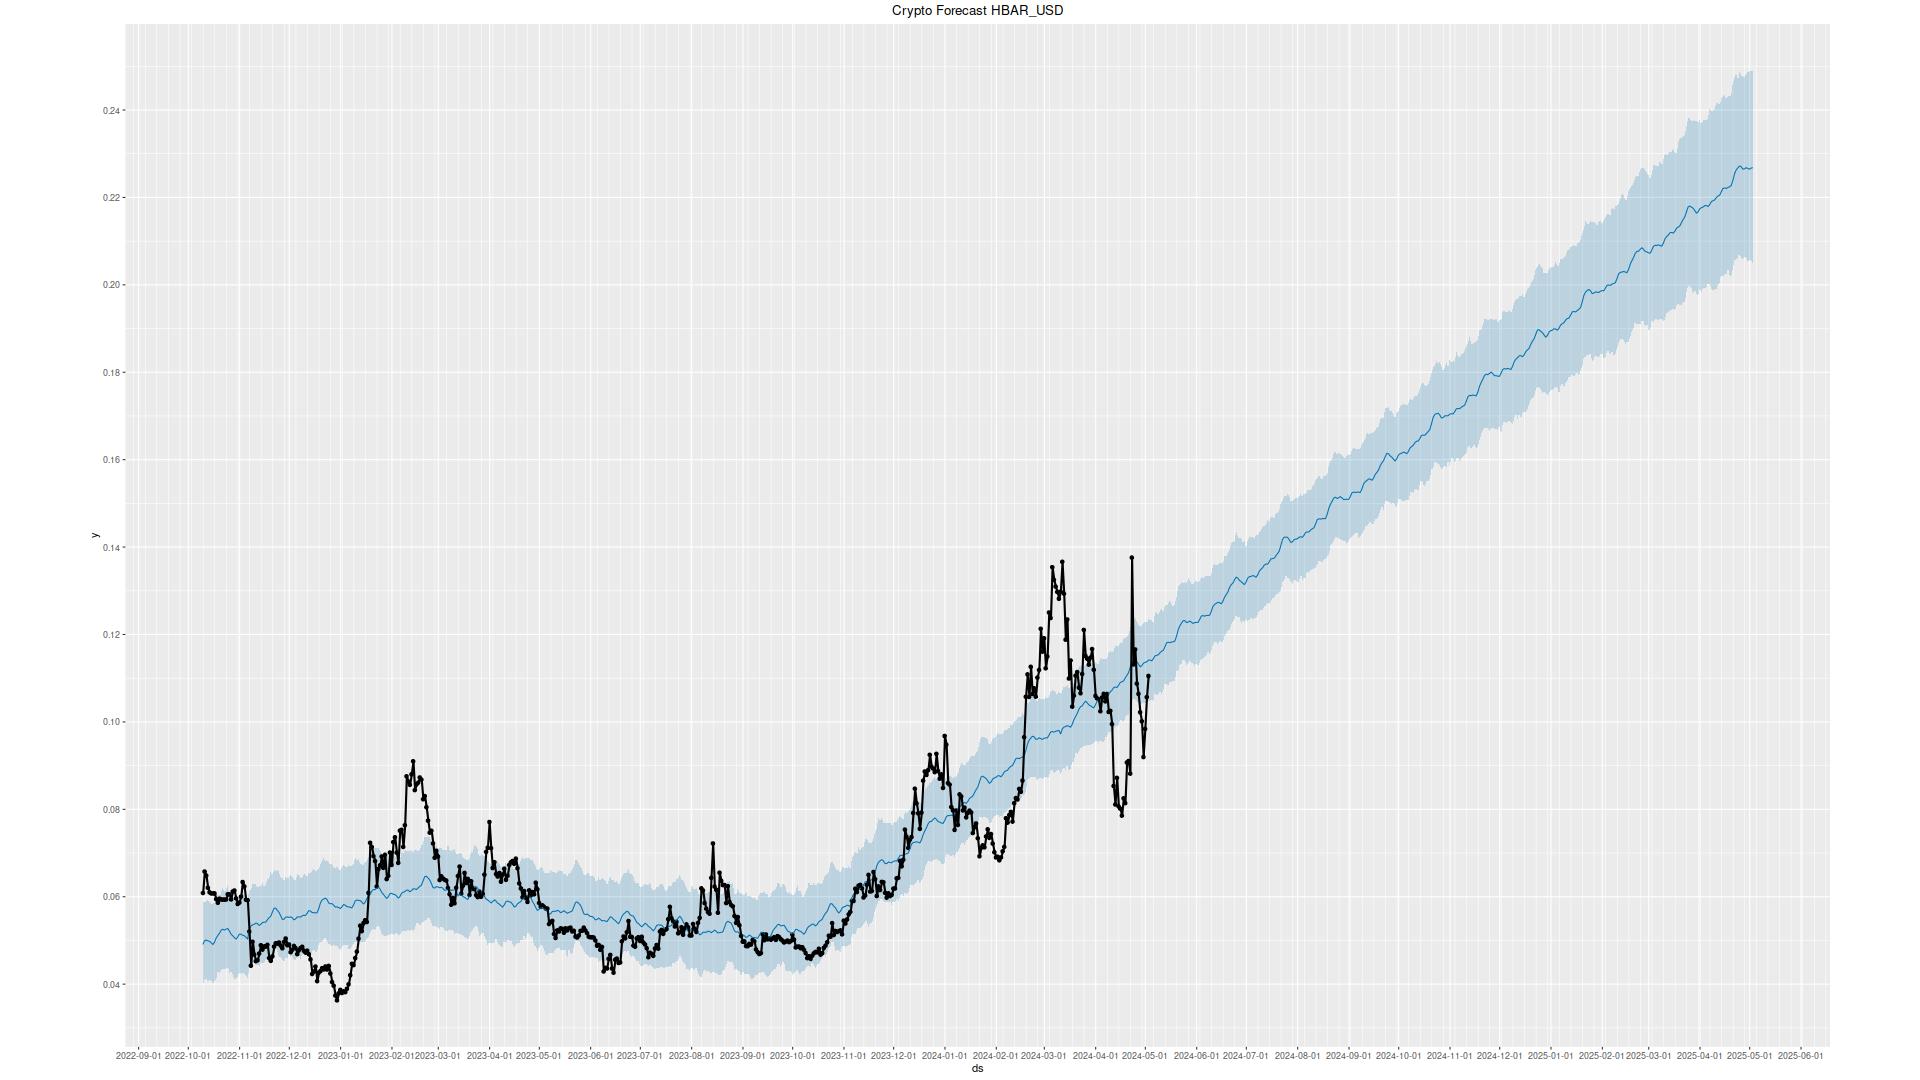
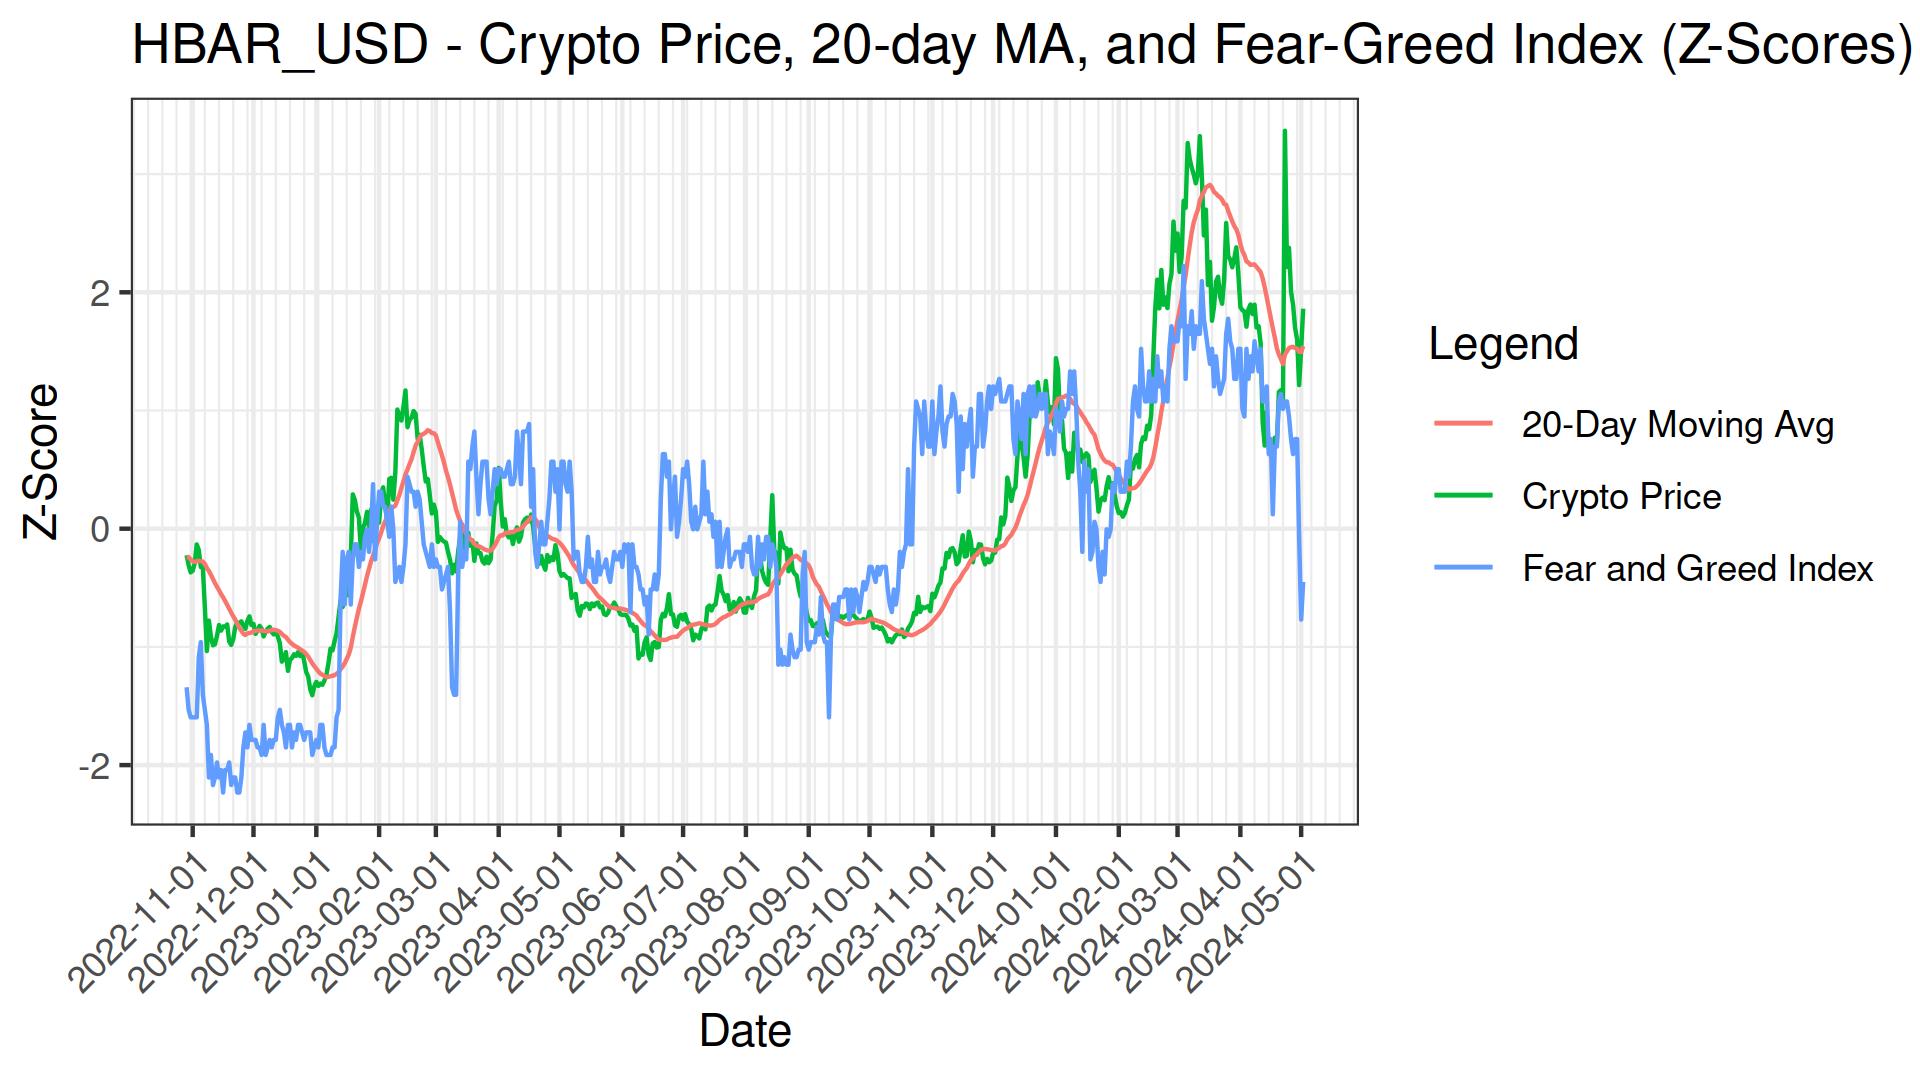
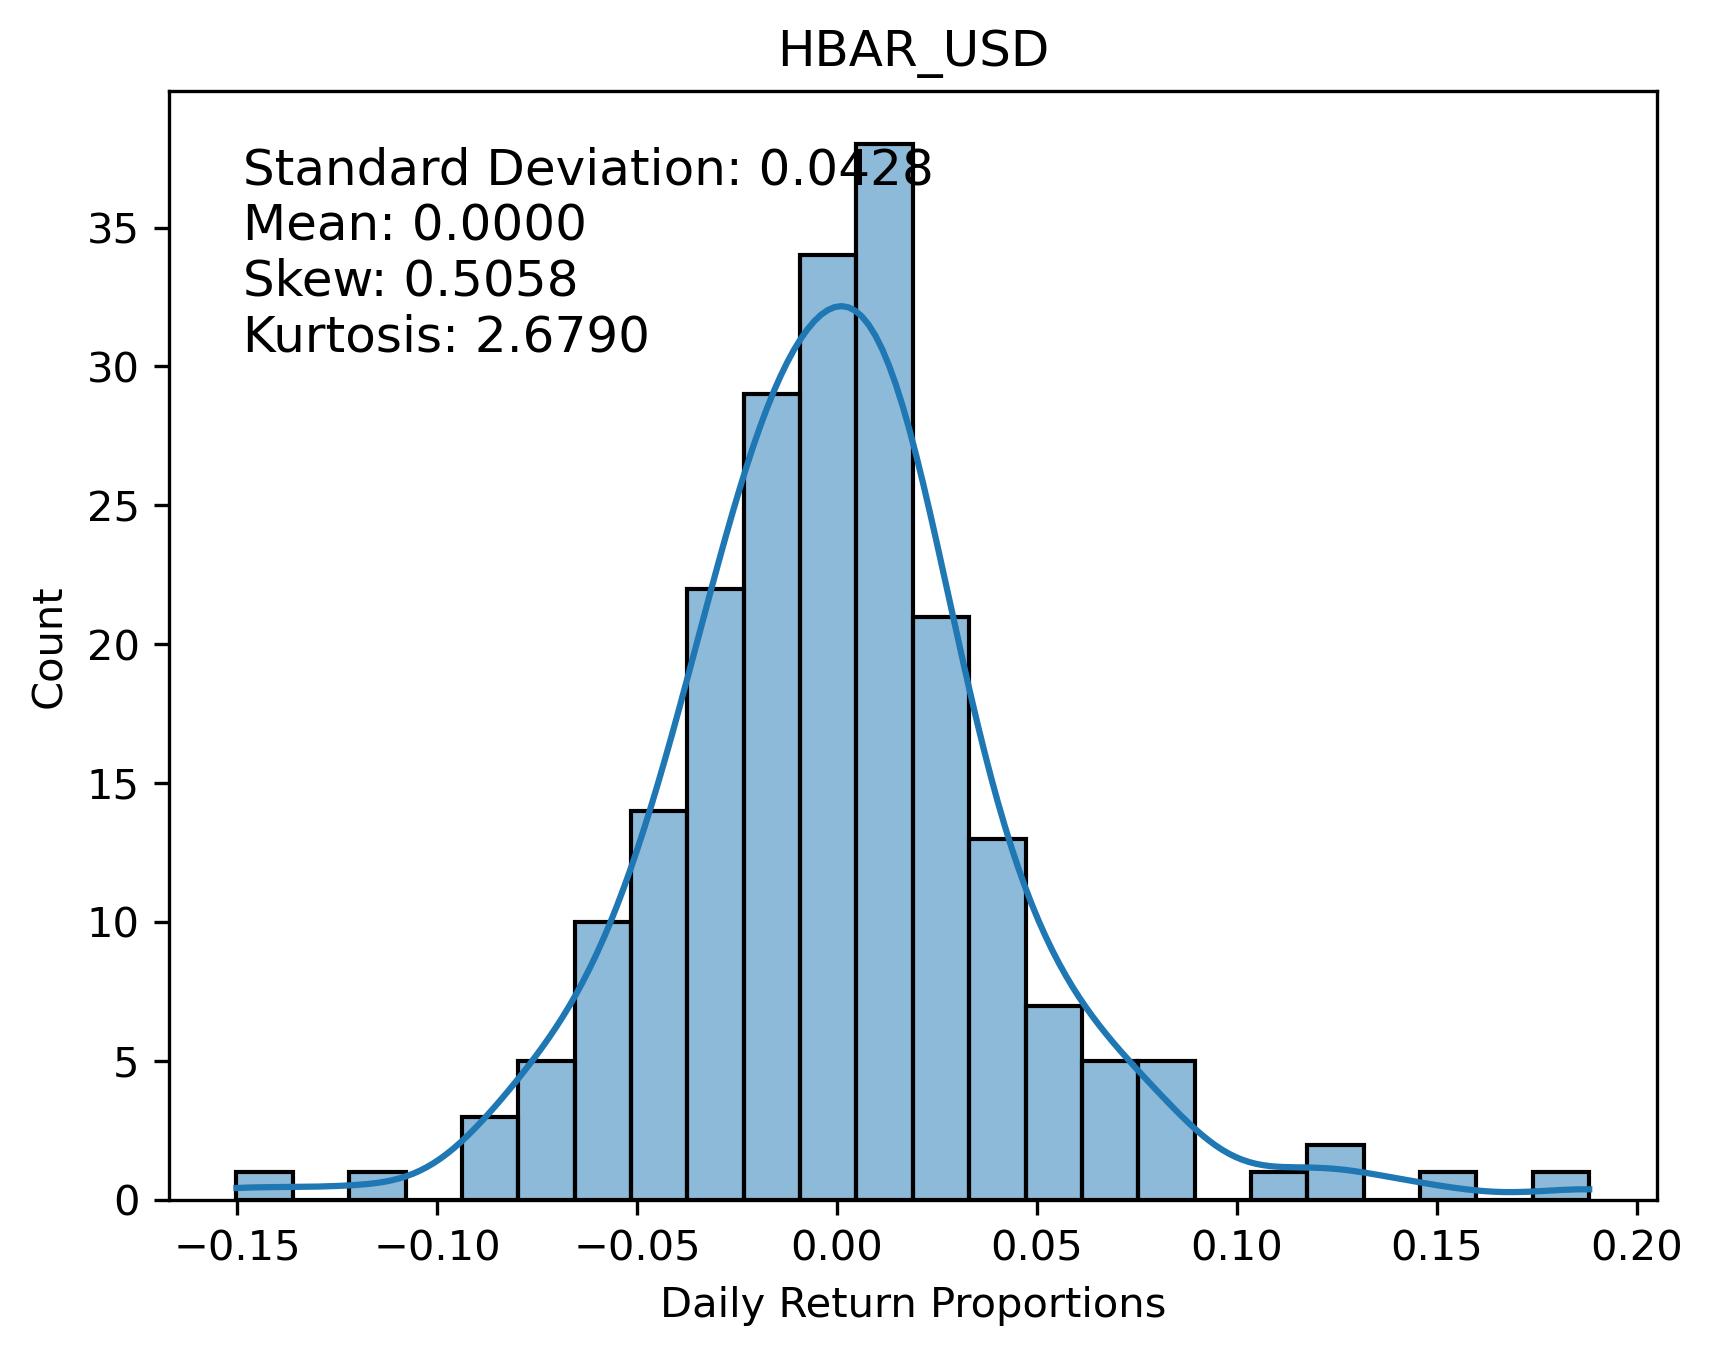
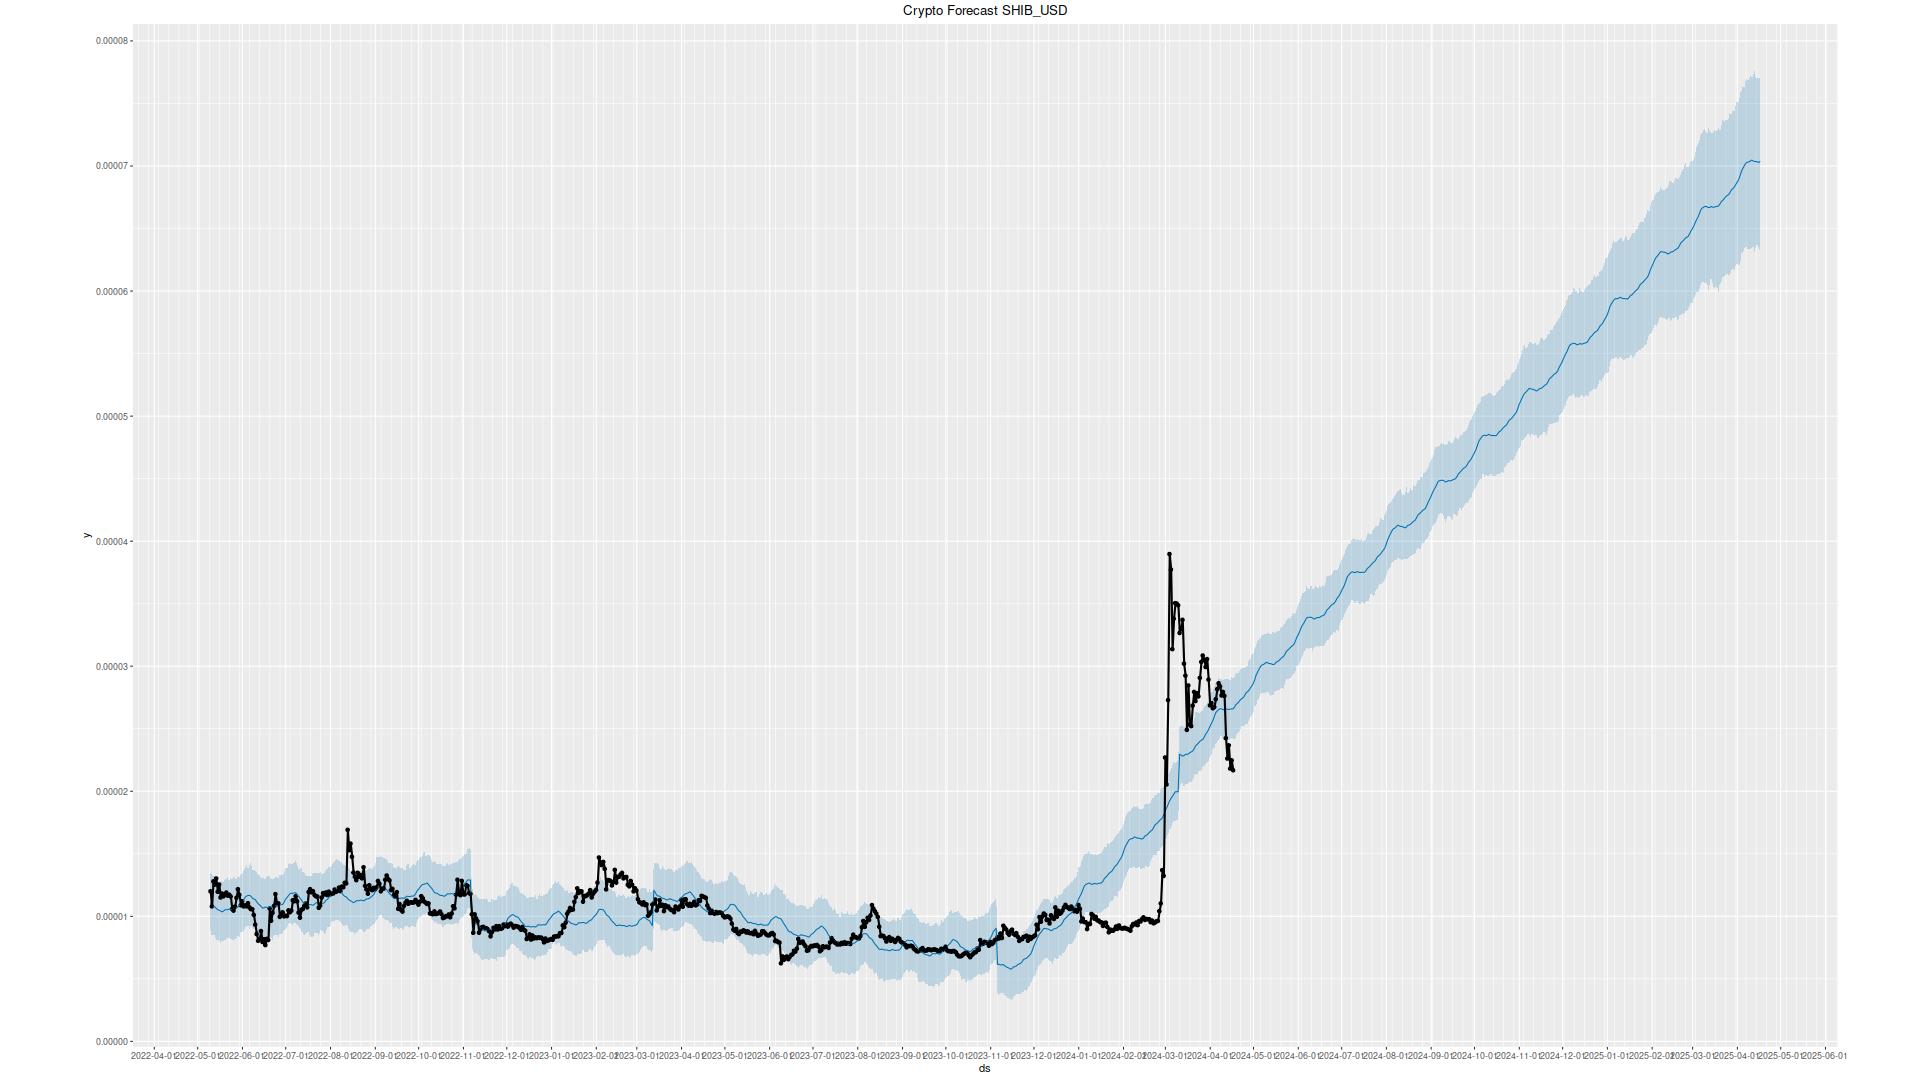
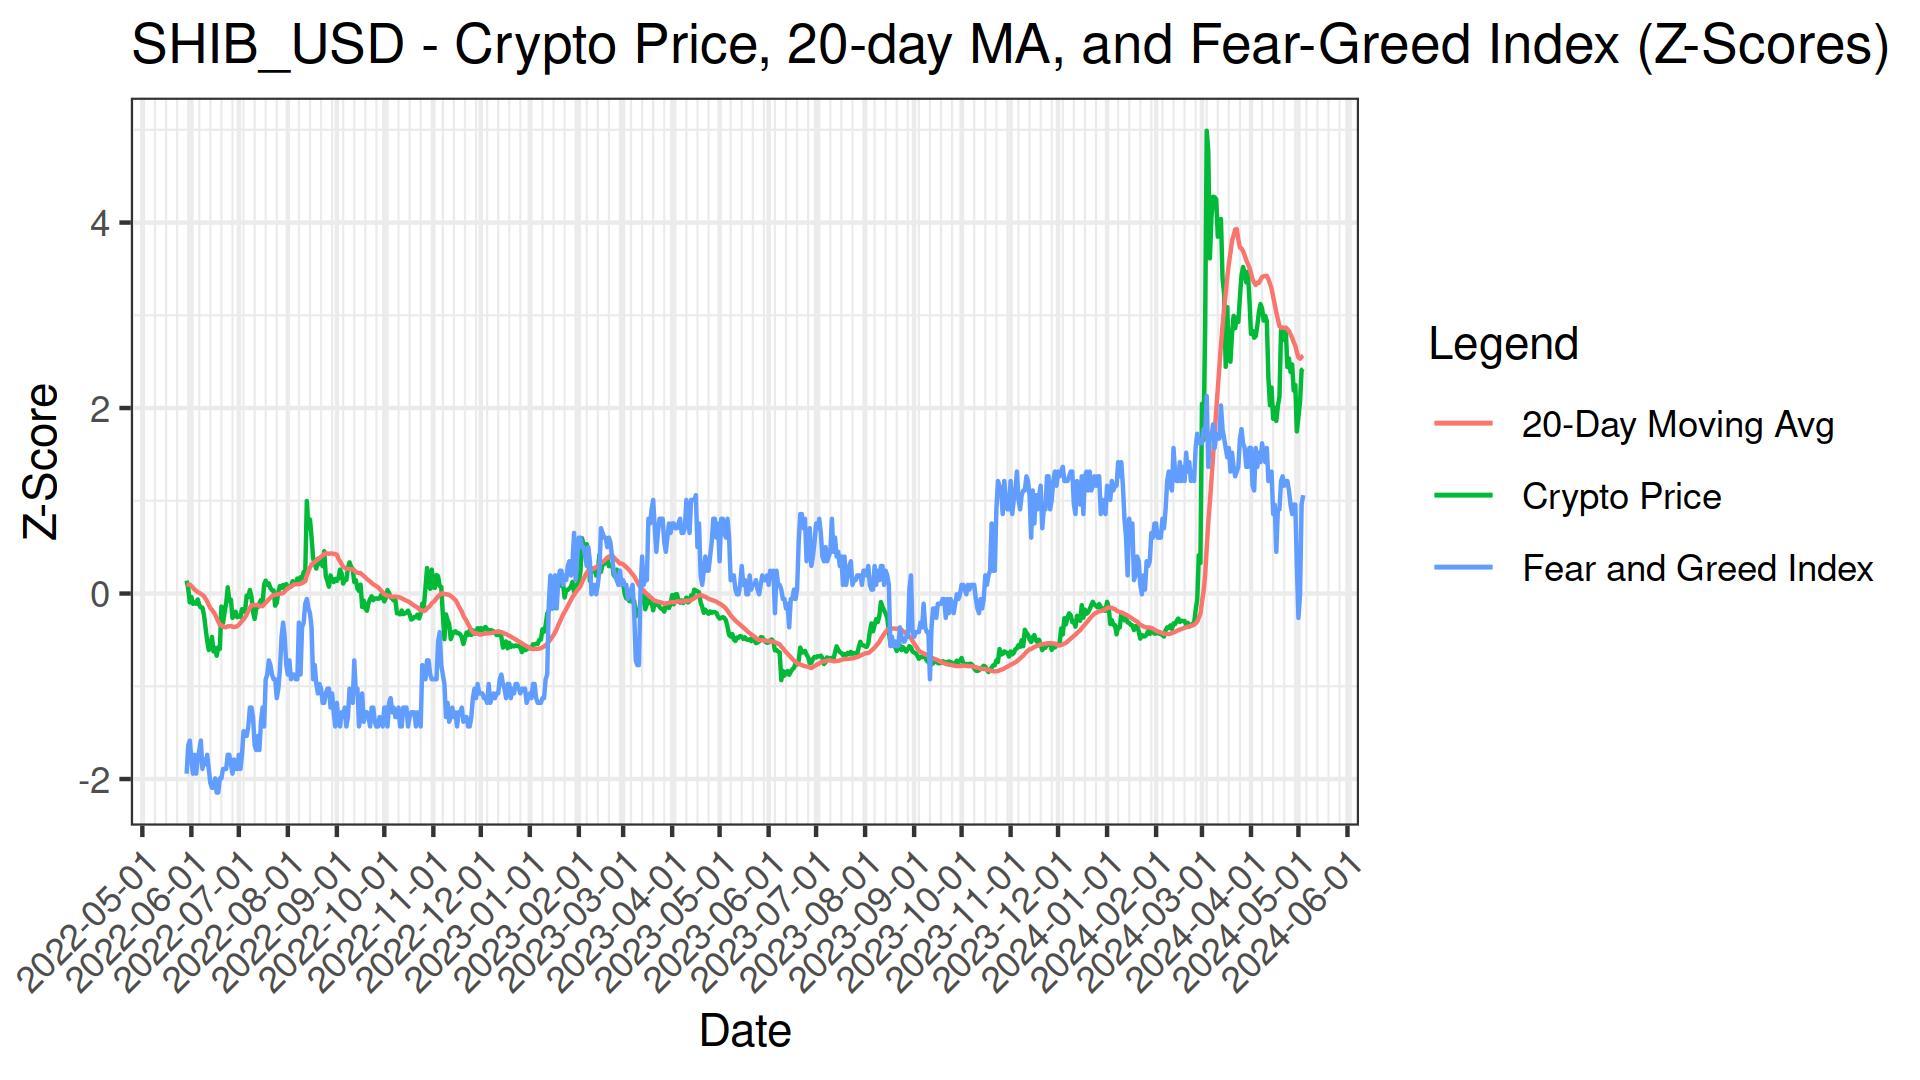
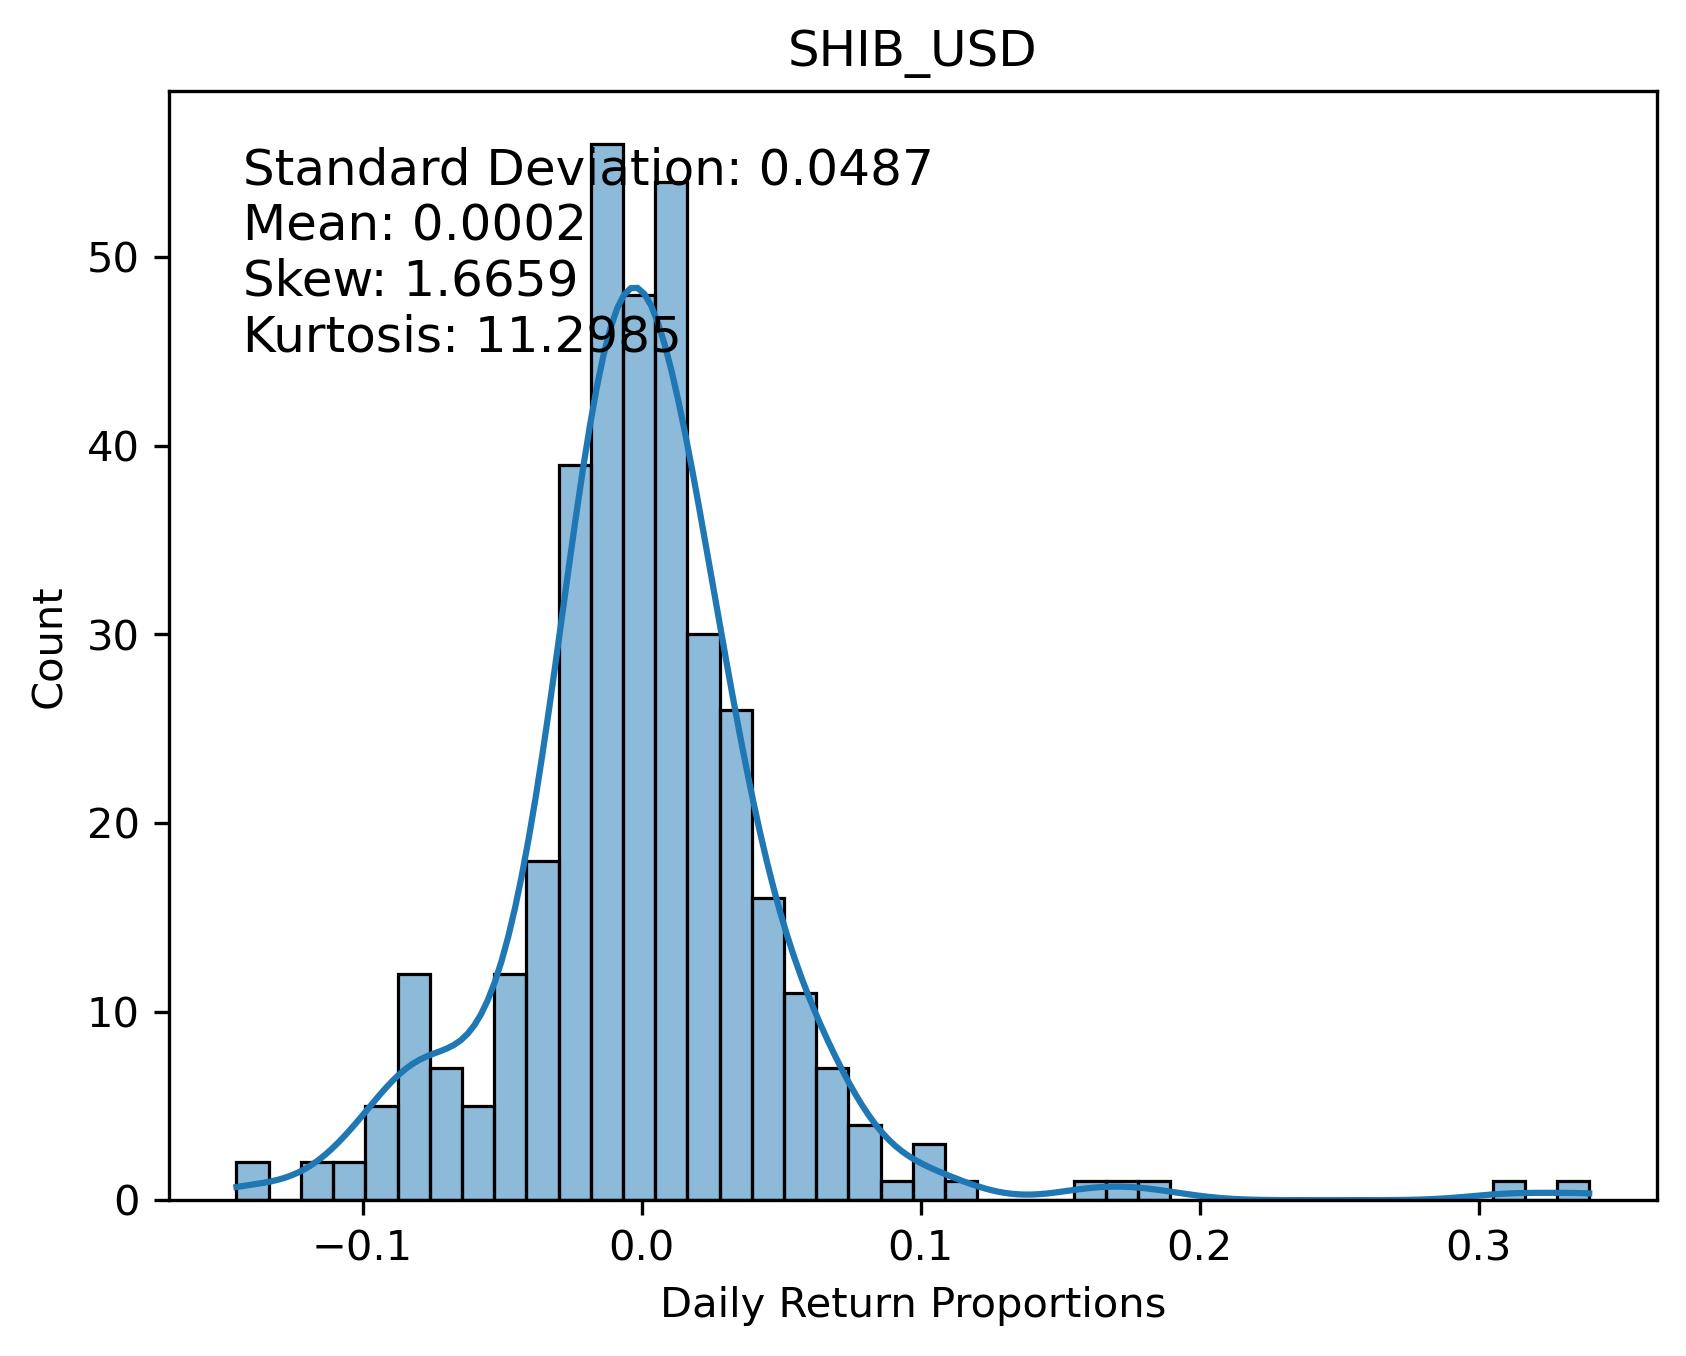
close: $0.07
pearsons cor(100-days): 0.6289
| Return Value | Short MA | Long MA | Buy Date | Sell Date | Latest Action | Sharpe Ratio | Drawdown |
|---|---|---|---|---|---|---|---|
| 184.09% | 20 | 137 | 2024-05-28 | 2024-06-17 | 2.36 | 0.00% | |
| 181.35% | 10 | 57 | 2024-05-27 | 2024-06-14 | 1.91 | -3.73% | |
| 176.97% | 10 | 58 | 2024-05-27 | 2024-06-14 | 1.85 | -3.73% | |
| 176.28% | 18 | 50 | 2024-05-25 | 2024-06-17 | 1.74 | -4.44% | |
| 174.53% | 12 | 66 | 2024-05-28 | 2024-06-16 | 1.98 | -0.82% | |
| 176.24% | 16 | 52 | 2024-05-27 | 2024-06-17 | 1.61 | -6.46% | |
| 171.77% | 11 | 70 | 2024-05-28 | 2024-06-14 | 1.84 | -2.44% |
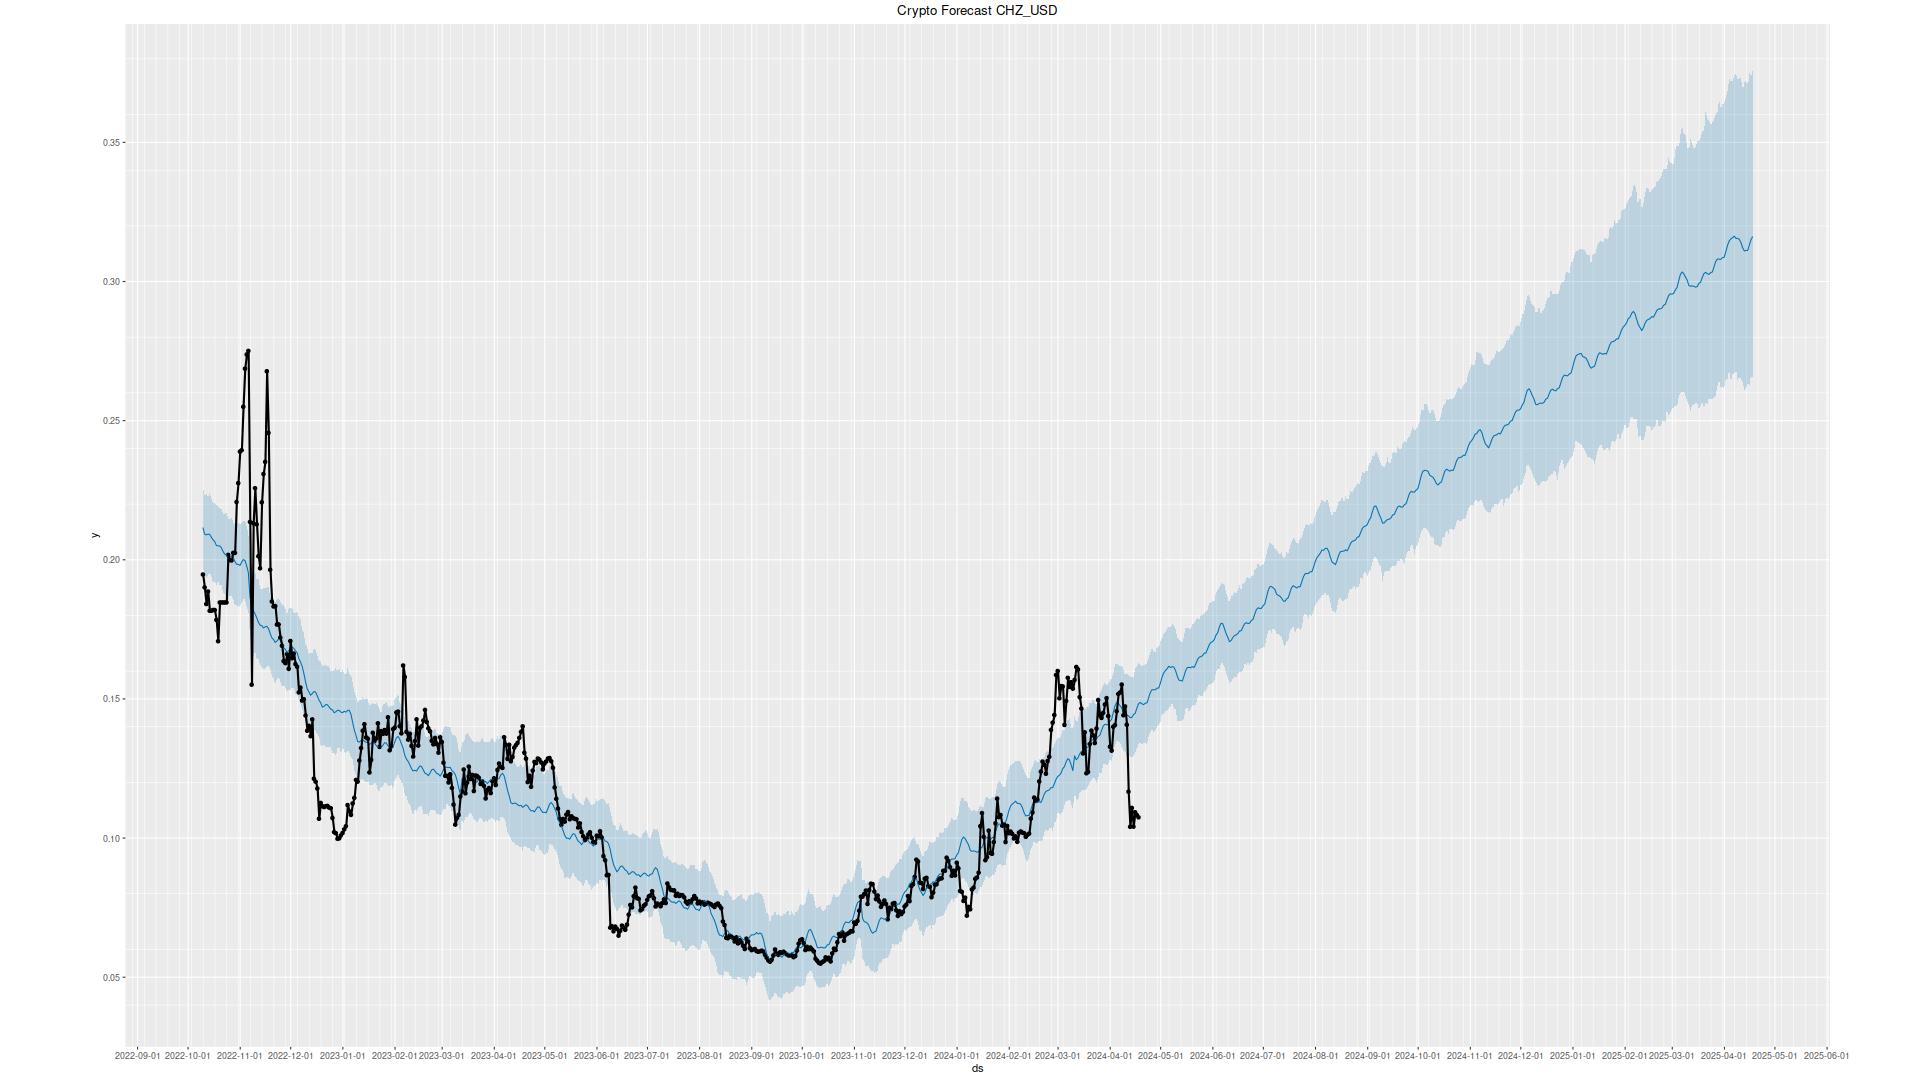
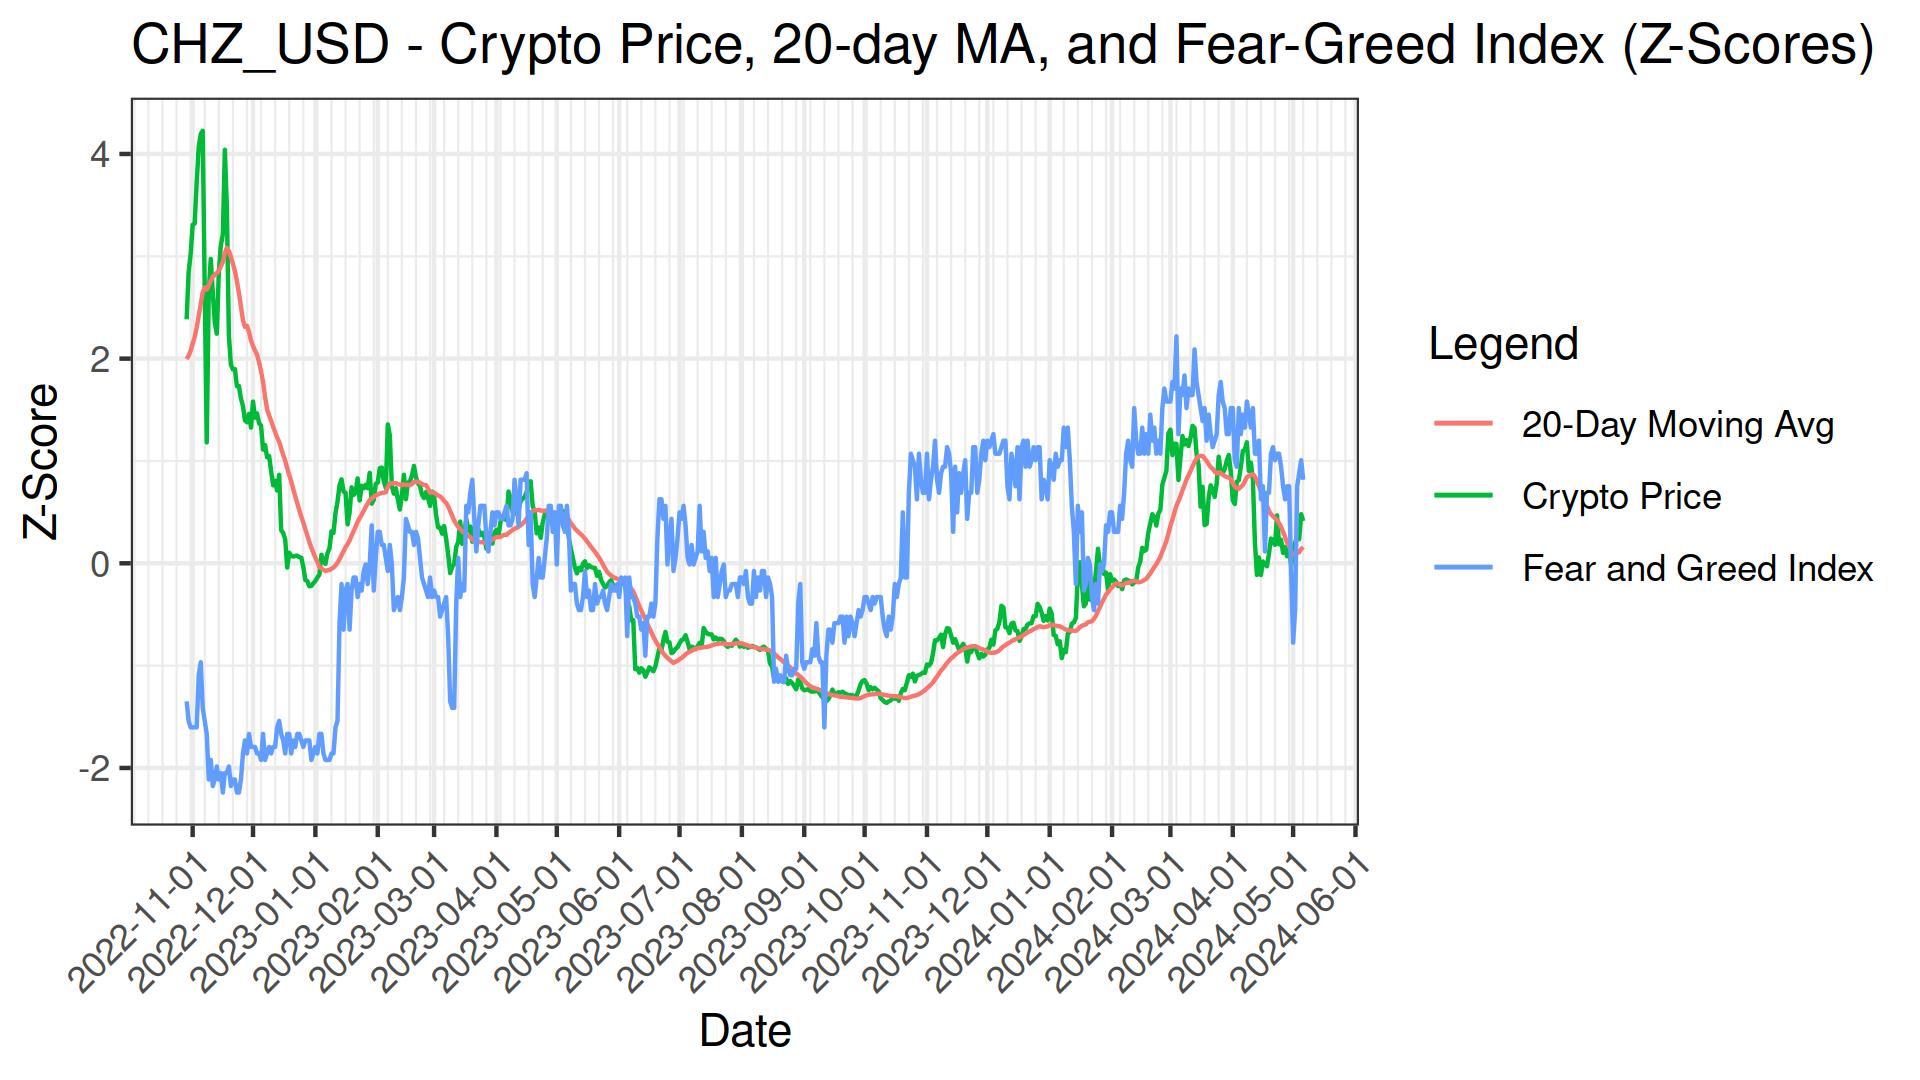
close: $0.27
pearsons cor(100-days): 0.5680
| Return Value | Short MA | Long MA | Buy Date | Sell Date | Latest Action | Sharpe Ratio | Drawdown |
|---|---|---|---|---|---|---|---|
| 286.84% | 17 | 58 | 2024-06-02 | 2024-06-12 | 1.91 | -6.96% | |
| 282.00% | 18 | 57 | 2024-06-02 | 2024-06-12 | 1.88 | -4.60% | |
| 272.56% | 10 | 52 | 2024-05-27 | 2024-06-10 | 1.93 | -7.25% | |
| 264.07% | 18 | 56 | 2024-06-01 | 2024-06-12 | 1.76 | -2.73% | |
| 264.54% | 17 | 57 | 2024-06-02 | 2024-06-12 | 1.75 | -6.31% | |
| 252.16% | 10 | 51 | 2024-05-26 | 2024-06-10 | 1.80 | -7.25% | |
| 250.21% | 18 | 58 | 2024-06-02 | 2024-06-12 | 1.67 | -4.40% |
close: $0.13
pearsons cor(100-days): 0.7636
| Return Value | Short MA | Long MA | Buy Date | Sell Date | Latest Action | Sharpe Ratio | Drawdown |
|---|---|---|---|---|---|---|---|
| 289.18% | 19 | 88 | 2024-02-28 | 2024-05-08 | 1.60 | -1.39% | |
| 281.71% | 20 | 87 | 2024-02-28 | 2024-05-08 | 1.56 | -1.29% | |
| 281.71% | 20 | 88 | 2024-02-28 | 2024-05-08 | 1.56 | -1.29% | |
| 281.79% | 16 | 89 | 2024-02-28 | 2024-05-07 | 1.56 | -2.23% | |
| 272.87% | 21 | 87 | 2024-02-28 | 2024-05-07 | 1.50 | -4.05% | |
| 267.45% | 19 | 90 | 2024-02-28 | 2024-05-09 | 1.45 | -4.44% | |
| 266.90% | 17 | 90 | 2024-02-28 | 2024-05-08 | 1.46 | -3.76% |
close: $5.89
pearsons cor(100-days): 0.4942
| Return Value | Short MA | Long MA | Buy Date | Sell Date | Latest Action | Sharpe Ratio | Drawdown |
|---|---|---|---|---|---|---|---|
| 183.40% | 10 | 58 | 2024-06-02 | 2024-06-07 | 2.08 | -2.48% | |
| 181.21% | 10 | 59 | 2024-06-06 | 2024-06-07 | 2.04 | -2.42% | |
| 176.17% | 10 | 79 | 2024-02-14 | 2024-04-12 | 1.76 | -2.62% | |
| 169.75% | 11 | 56 | 2024-05-26 | 2024-06-08 | 1.87 | -2.26% | |
| 169.23% | 10 | 78 | 2024-02-14 | 2024-04-12 | 1.52 | -7.72% | |
| 167.45% | 10 | 80 | 2024-02-13 | 2024-04-12 | 1.60 | -4.42% | |
| 162.15% | 11 | 74 | 2024-02-17 | 2024-04-11 | 1.67 | -4.62% |
close: $0.19
pearsons cor(100-days): 0.6074
| Return Value | Short MA | Long MA | Buy Date | Sell Date | Latest Action | Sharpe Ratio | Drawdown |
|---|---|---|---|---|---|---|---|
| 266.79% | 11 | 57 | 2024-05-27 | 2024-06-07 | 2.38 | -1.49% | |
| 235.06% | 12 | 54 | 2024-05-27 | 2024-06-08 | 1.95 | -2.03% | |
| 235.60% | 11 | 55 | 2024-05-27 | 2024-06-07 | 1.87 | -3.69% | |
| 231.91% | 12 | 55 | 2024-05-27 | 2024-06-08 | 1.93 | -1.49% | |
| 223.41% | 15 | 50 | 2024-05-27 | 2024-06-09 | 1.89 | -3.03% | |
| 219.70% | 12 | 56 | 2024-05-27 | 2024-06-08 | 1.96 | -1.94% | |
| 215.36% | 11 | 56 | 2024-05-27 | 2024-06-07 | 1.80 | -3.69% |
close: $0.58
pearsons cor(100-days): 0.6322
| Return Value | Short MA | Long MA | Buy Date | Sell Date | Latest Action | Sharpe Ratio | Drawdown |
|---|---|---|---|---|---|---|---|
| 156.04% | 12 | 52 | 2024-05-30 | 2024-06-06 | 1.74 | -1.72% | |
| 154.35% | 13 | 50 | 2024-07-26 | 2024-06-06 | buy now | 1.69 | -2.09% |
| 149.21% | 12 | 50 | 2024-07-26 | 2024-06-05 | buy now | 1.49 | -3.13% |
| 148.04% | 13 | 51 | 2024-05-29 | 2024-06-06 | 1.51 | -2.33% | |
| 145.86% | 12 | 51 | 2024-05-29 | 2024-06-06 | 1.46 | -2.33% | |
| 144.15% | 12 | 55 | 2024-06-04 | 2024-06-06 | 1.71 | -1.10% | |
| 141.21% | 16 | 53 | 2024-05-31 | 2024-06-07 | 1.58 | -0.56% |
close: $3.28K

pearsons cor(100-days): 0.4628
| Return Value | Short MA | Long MA | Buy Date | Sell Date | Latest Action | Sharpe Ratio | Drawdown |
|---|---|---|---|---|---|---|---|
| 164.35% | 11 | 111 | 2024-07-21 | 2024-07-03 | 1.69 | -0.55% | |
| 163.41% | 11 | 76 | 2024-07-23 | 2024-07-24 | 1.93 | -1.19% | |
| 161.69% | 10 | 95 | 2024-07-20 | 2024-07-04 | 1.50 | -3.81% | |
| 159.80% | 12 | 107 | 2024-07-22 | 2024-07-04 | 1.56 | -0.65% | |
| 155.96% | 13 | 70 | 2024-05-24 | 2024-07-03 | 1.68 | -3.17% | |
| 154.43% | 12 | 106 | 2024-07-22 | 2024-07-04 | 1.44 | -0.65% | |
| 153.50% | 14 | 82 | 2024-05-26 | 2024-07-04 | 1.97 | -1.01% |
close: $4.62
pearsons cor(100-days): 0.6796
| Return Value | Short MA | Long MA | Buy Date | Sell Date | Latest Action | Sharpe Ratio | Drawdown |
|---|---|---|---|---|---|---|---|
| 217.71% | 10 | 51 | 2024-06-08 | 2024-06-14 | 1.48 | -5.94% | |
| 217.01% | 13 | 59 | 2024-02-19 | 2024-04-12 | 1.57 | -5.14% | |
| 211.08% | 15 | 60 | 2024-02-19 | 2024-04-12 | 1.50 | -5.05% | |
| 204.30% | 14 | 59 | 2024-02-19 | 2024-04-12 | 1.42 | -8.48% | |
| 201.87% | 15 | 51 | 2024-06-10 | 2024-06-11 | 1.23 | -6.73% | |
| 200.13% | 15 | 52 | 2024-02-19 | 2024-04-09 | 1.22 | -11.52% | |
| 197.85% | 15 | 53 | 2024-02-19 | 2024-04-09 | 1.19 | -11.52% |
close: $0.47
pearsons cor(100-days): 0.6276
| Return Value | Short MA | Long MA | Buy Date | Sell Date | Latest Action | Sharpe Ratio | Drawdown |
|---|---|---|---|---|---|---|---|
| 198.41% | 12 | 53 | 2024-05-20 | 2024-06-12 | 2.01 | -2.53% | |
| 184.99% | 12 | 51 | 2024-05-20 | 2024-06-12 | 1.85 | -2.53% | |
| 182.95% | 13 | 69 | 2024-05-26 | 2024-06-11 | 2.19 | -2.71% | |
| 180.49% | 19 | 82 | 2024-06-02 | 2024-06-06 | 1.93 | -1.95% | |
| 172.67% | 13 | 68 | 2024-05-26 | 2024-06-11 | 2.08 | -0.60% | |
| 171.25% | 14 | 63 | 2024-05-25 | 2024-06-14 | 2.37 | -0.40% | |
| 171.39% | 18 | 79 | 2024-06-01 | 2024-06-06 | 1.92 | -1.79% |
close: $0.07
pearsons cor(100-days): 0.5309
| Return Value | Short MA | Long MA | Buy Date | Sell Date | Latest Action | Sharpe Ratio | Drawdown |
|---|---|---|---|---|---|---|---|
| 229.81% | 19 | 139 | 2024-05-01 | 2024-06-09 | 1.33 | -0.51% | |
| 222.82% | 12 | 174 | 2024-04-23 | 2024-06-10 | 1.28 | -0.16% | |
| 220.60% | 20 | 135 | 2024-05-02 | 2024-06-09 | 1.25 | -0.51% | |
| 220.36% | 19 | 138 | 2024-05-01 | 2024-06-09 | 1.25 | -4.04% | |
| 219.72% | 19 | 137 | 2024-05-01 | 2024-06-09 | 1.24 | -4.32% | |
| 218.94% | 19 | 140 | 2024-05-01 | 2024-06-10 | 1.23 | -4.34% | |
| 217.08% | 11 | 182 | 2024-04-23 | 2024-06-10 | 1.24 | 0.00% |
close: $1.55
pearsons cor(100-days): 0.6583
| Return Value | Short MA | Long MA | Buy Date | Sell Date | Latest Action | Sharpe Ratio | Drawdown |
|---|---|---|---|---|---|---|---|
| 202.21% | 11 | 50 | 2024-07-26 | 2024-06-07 | buy now | 2.33 | -6.97% |
| 180.29% | 16 | 69 | 2024-02-07 | 2024-04-04 | 1.96 | 0.00% | |
| 179.04% | 17 | 65 | 2024-05-30 | 2024-06-08 | 2.07 | -0.62% | |
| 175.68% | 12 | 189 | 2024-05-24 | 2024-05-29 | 1.35 | 0.00% | |
| 173.88% | 12 | 193 | 2024-05-22 | 2024-05-30 | 1.31 | -0.21% | |
| 170.05% | 12 | 192 | 2024-05-22 | 2024-05-30 | 1.26 | -0.21% | |
| 169.65% | 15 | 90 | 2023-10-30 | 2024-04-12 | 1.62 | -0.21% |
close: $21.99
pearsons cor(100-days): 0.6317

| Return Value | Short MA | Long MA | Buy Date | Sell Date | Latest Action | Sharpe Ratio | Drawdown |
|---|---|---|---|---|---|---|---|
| 159.86% | 20 | 69 | 2024-02-12 | 2024-04-04 | 1.64 | -3.02% | |
| 156.52% | 11 | 62 | 2024-06-12 | 2024-06-13 | 1.80 | -8.30% | |
| 150.84% | 21 | 69 | 2024-02-13 | 2024-04-04 | 1.50 | -2.62% | |
| 147.11% | 20 | 71 | 2023-11-01 | 2024-04-04 | 1.46 | 0.00% | |
| 147.11% | 19 | 71 | 2023-11-01 | 2024-04-04 | 1.46 | 0.00% | |
| 148.77% | 14 | 83 | 2023-11-01 | 2024-04-08 | 1.43 | -4.58% | |
| 147.38% | 11 | 61 | 2024-06-06 | 2024-06-13 | 1.88 | -2.36% |
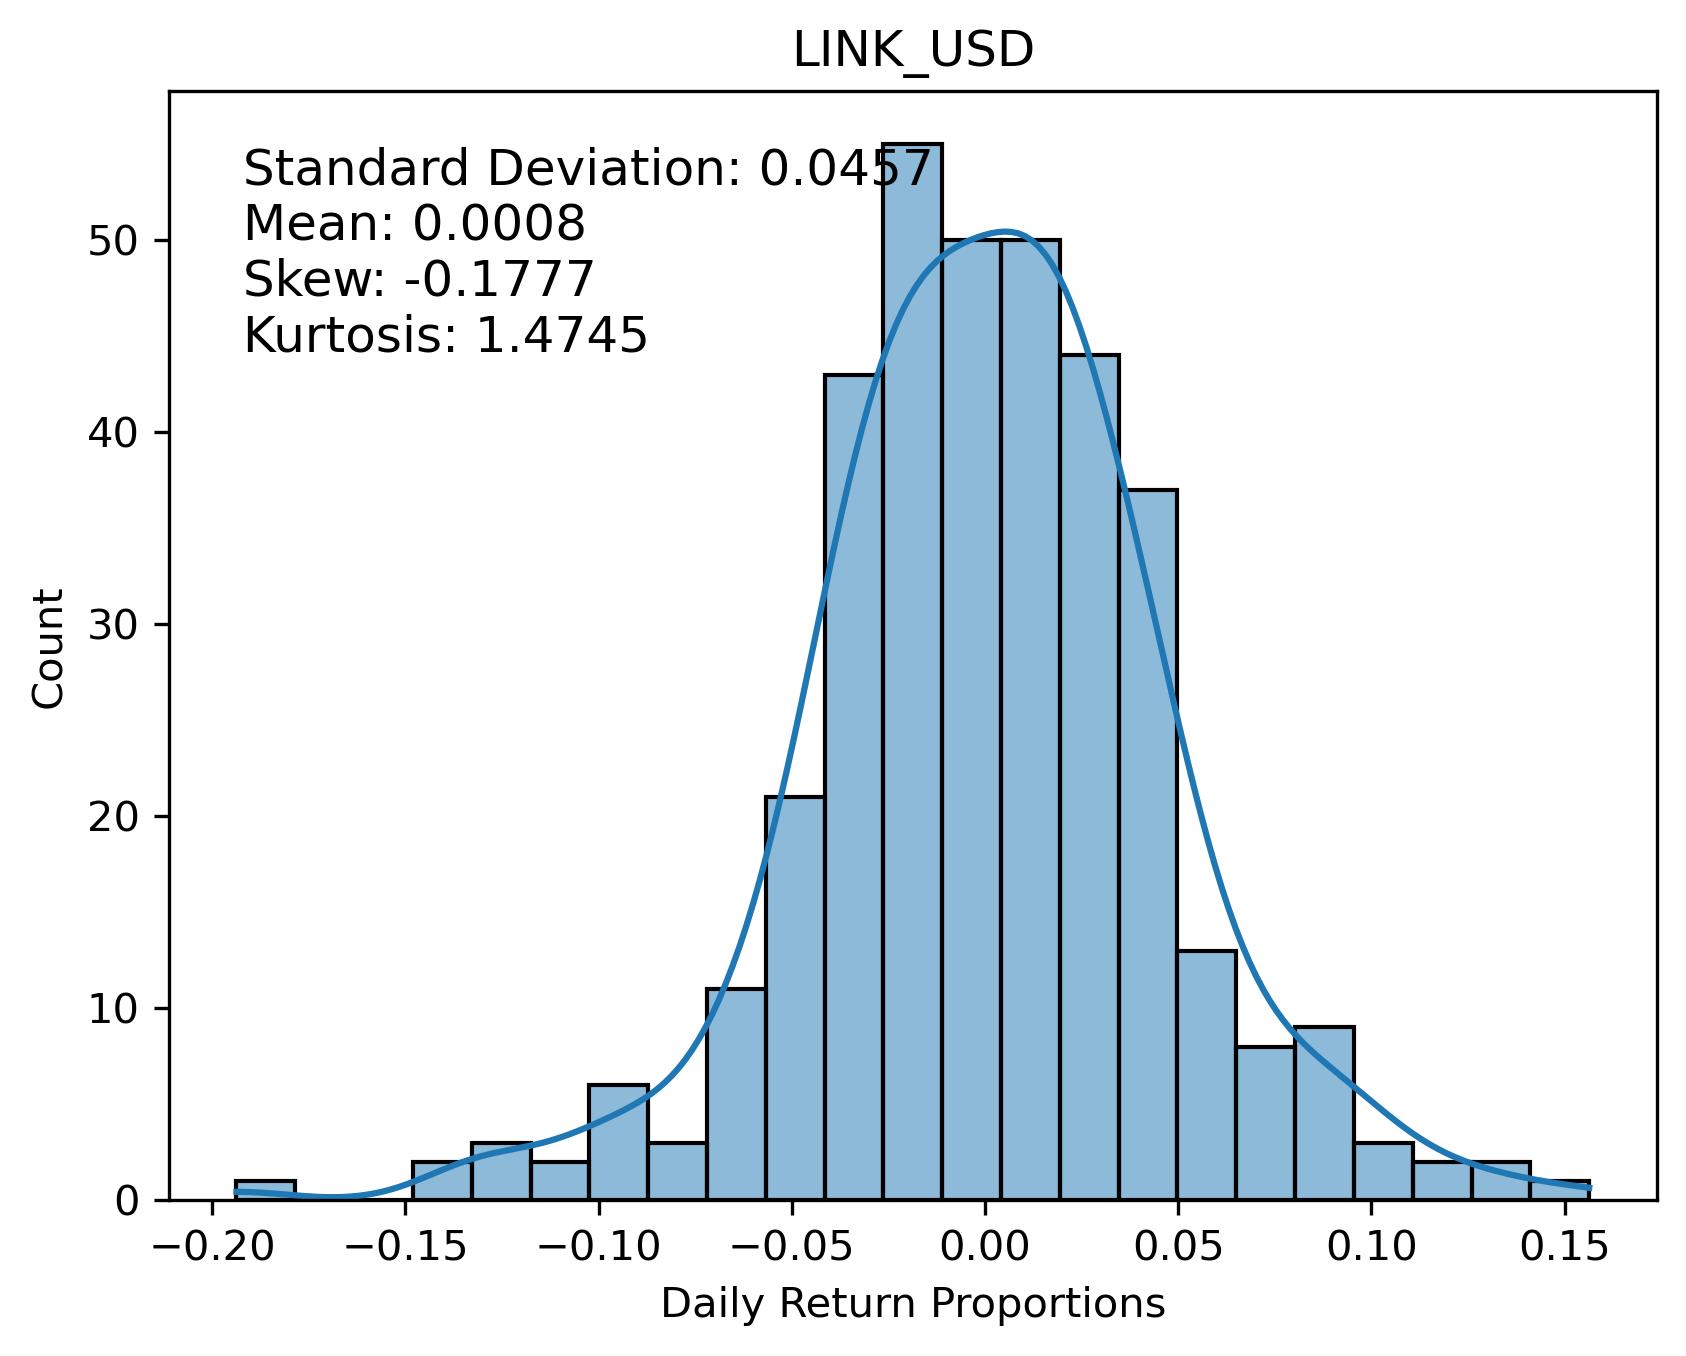
close: $13.69
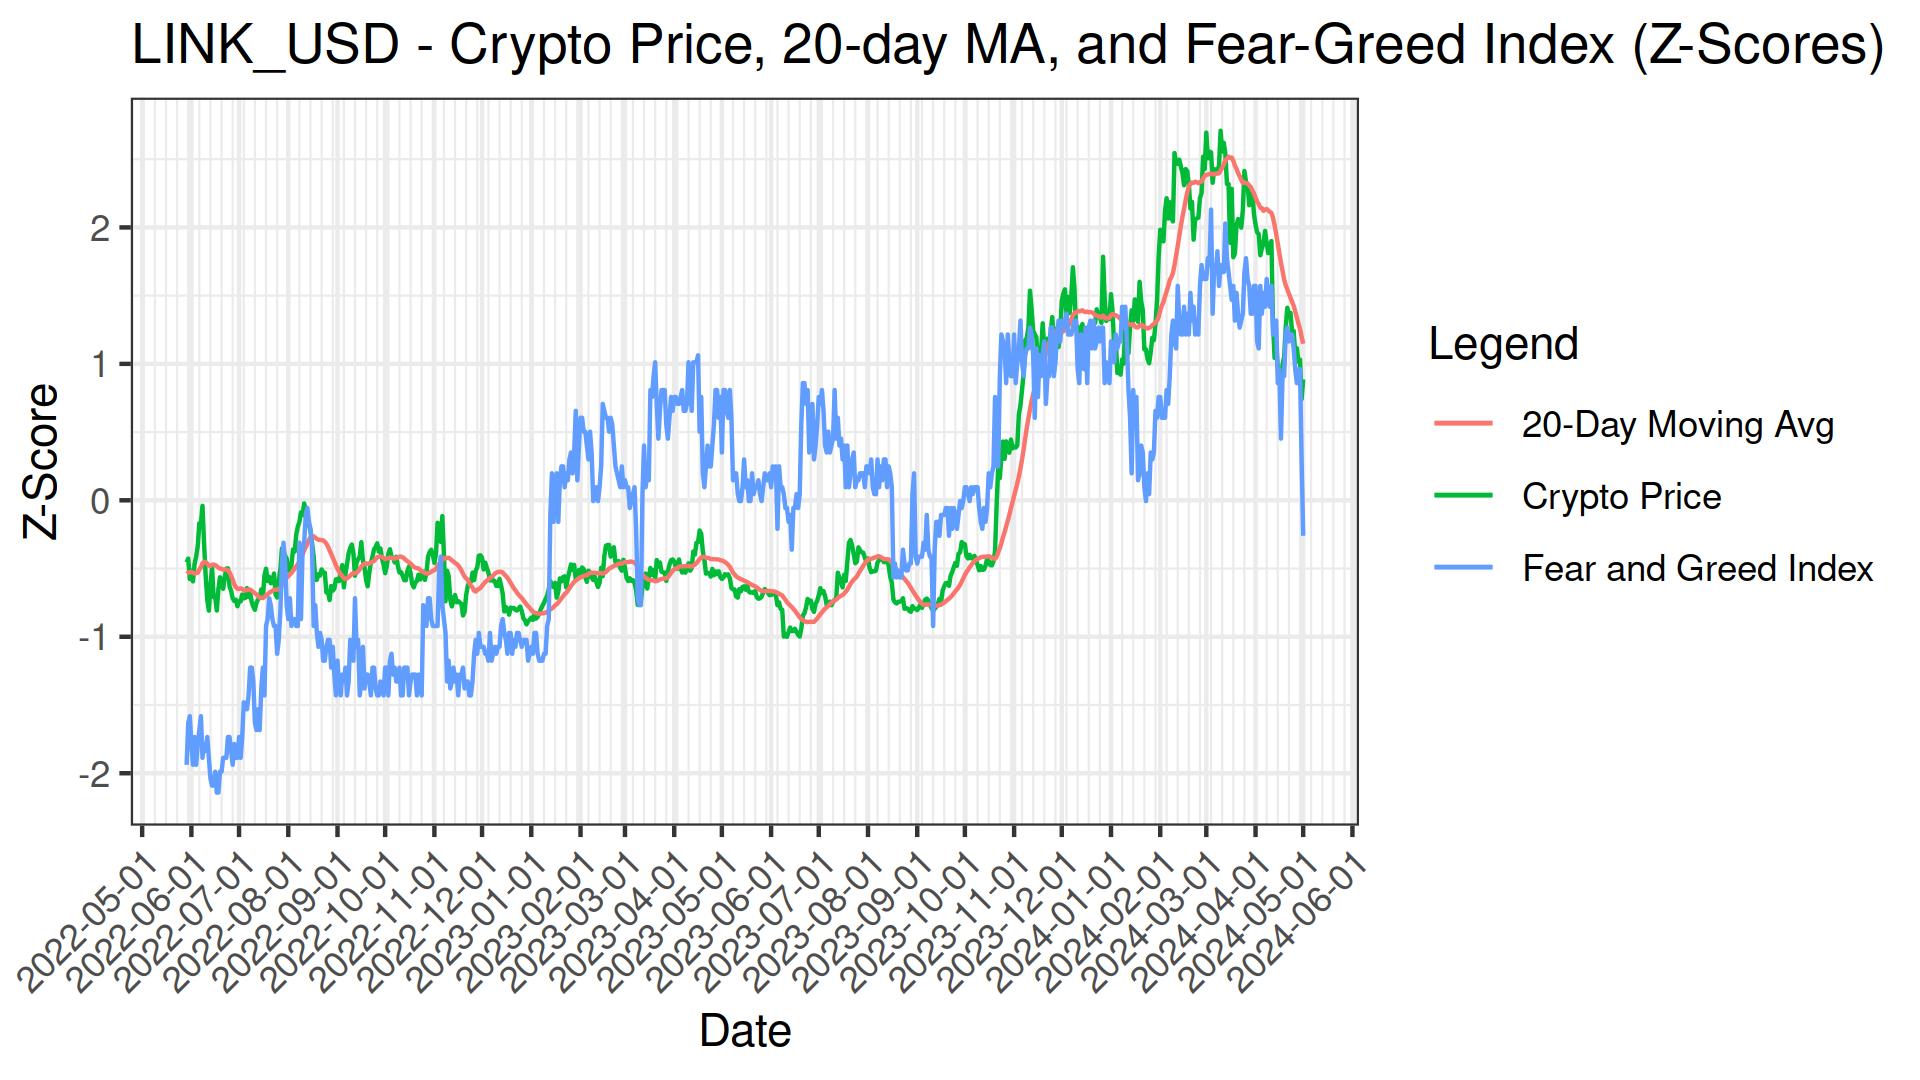
pearsons cor(100-days): 0.6359
| Return Value | Short MA | Long MA | Buy Date | Sell Date | Latest Action | Sharpe Ratio | Drawdown |
|---|---|---|---|---|---|---|---|
| 213.39% | 21 | 107 | 2024-06-04 | 2024-06-17 | 2.00 | -2.86% | |
| 190.23% | 16 | 65 | 2024-05-27 | 2024-06-20 | 2.20 | -4.35% | |
| 183.43% | 18 | 76 | 2024-05-29 | 2024-06-21 | 2.12 | -1.92% | |
| 181.84% | 12 | 87 | 2024-05-27 | 2024-06-15 | 2.04 | -3.57% | |
| 180.64% | 17 | 76 | 2024-05-29 | 2024-06-21 | 1.97 | -5.52% | |
| 180.68% | 12 | 85 | 2024-05-27 | 2024-06-15 | 1.83 | -8.17% | |
| 178.04% | 15 | 68 | 2024-05-27 | 2024-06-20 | 1.93 | -4.28% |
close: $71.50
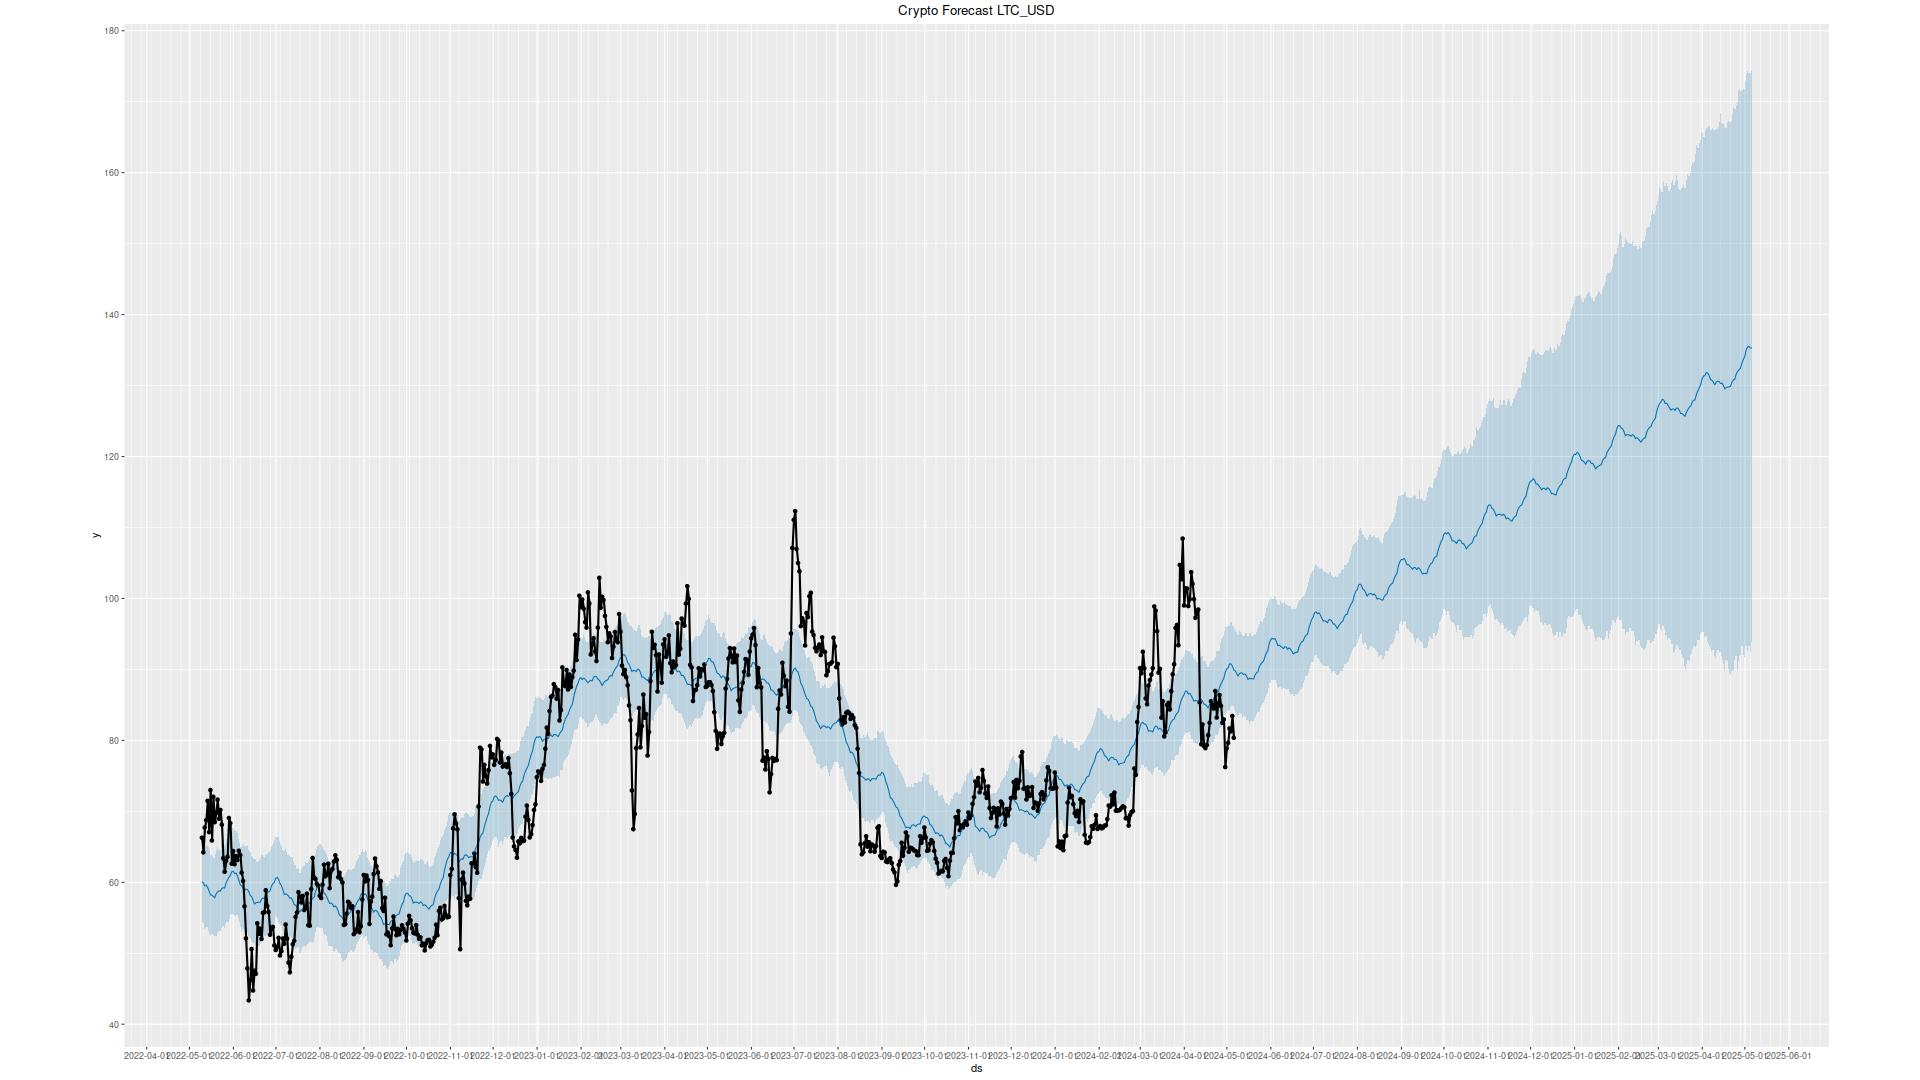
pearsons cor(100-days): 0.7083
| Return Value | Short MA | Long MA | Buy Date | Sell Date | Latest Action | Sharpe Ratio | Drawdown |
|---|---|---|---|---|---|---|---|
| 201.54% | 12 | 71 | 2024-02-26 | 2024-04-20 | 2.03 | -3.67% | |
| 197.93% | 13 | 67 | 2024-02-17 | 2024-04-21 | 2.17 | -1.39% | |
| 198.01% | 13 | 66 | 2024-02-17 | 2024-04-20 | 2.13 | -3.67% | |
| 197.63% | 12 | 69 | 2024-02-26 | 2024-04-20 | 2.02 | -3.67% | |
| 194.62% | 12 | 78 | 2024-02-26 | 2024-04-22 | 2.14 | -0.97% | |
| 184.66% | 13 | 68 | 2024-02-17 | 2024-04-21 | 2.03 | -1.39% | |
| 185.14% | 13 | 64 | 2024-02-16 | 2024-04-20 | 1.95 | -3.67% |
close: $0.35
pearsons cor(100-days): 0.6637
| Return Value | Short MA | Long MA | Buy Date | Sell Date | Latest Action | Sharpe Ratio | Drawdown |
|---|---|---|---|---|---|---|---|
| 181.49% | 14 | 61 | 2024-02-19 | 2024-04-12 | 1.76 | -0.75% | |
| 180.59% | 15 | 59 | 2024-06-06 | 2024-06-12 | 1.74 | -1.10% | |
| 178.12% | 19 | 55 | 2024-06-04 | 2024-06-12 | 1.59 | -2.13% | |
| 174.92% | 14 | 65 | 2024-02-19 | 2024-04-12 | 1.69 | -2.25% | |
| 174.86% | 20 | 54 | 2024-06-03 | 2024-06-13 | 1.48 | -3.08% | |
| 171.45% | 19 | 53 | 2024-06-02 | 2024-06-12 | 1.79 | -1.09% | |
| 172.78% | 18 | 54 | 2024-06-03 | 2024-06-12 | 1.52 | -4.14% |
close: $0.52
pearsons cor(100-days): 0.6077

| Return Value | Short MA | Long MA | Buy Date | Sell Date | Latest Action | Sharpe Ratio | Drawdown |
|---|---|---|---|---|---|---|---|
| 195.13% | 10 | 57 | 2024-02-15 | 2024-03-31 | 2.01 | -5.70% | |
| 189.32% | 21 | 65 | 2024-02-18 | 2024-04-05 | 1.54 | -2.45% | |
| 178.19% | 11 | 69 | 2024-02-15 | 2024-04-04 | 1.35 | -5.30% | |
| 177.17% | 11 | 50 | 2024-05-28 | 2024-06-07 | 1.60 | -7.27% | |
| 175.57% | 12 | 53 | 2024-05-31 | 2024-06-08 | 1.76 | -6.16% | |
| 172.37% | 12 | 55 | 2024-06-04 | 2024-06-07 | 2.03 | -5.17% | |
| 172.29% | 12 | 69 | 2024-02-16 | 2024-04-04 | 1.26 | -5.30% |
close: $0.52
pearsons cor(100-days): 0.6354
| Return Value | Short MA | Long MA | Buy Date | Sell Date | Latest Action | Sharpe Ratio | Drawdown |
|---|---|---|---|---|---|---|---|
| 273.56% | 19 | 81 | 2023-10-23 | 2024-03-31 | 1.07 | 0.00% | |
| 258.87% | 20 | 78 | 2023-10-23 | 2024-04-01 | 0.99 | 0.00% | |
| 251.94% | 10 | 116 | 2023-10-23 | 2024-04-03 | 0.94 | -0.16% | |
| 246.43% | 10 | 115 | 2023-10-23 | 2024-04-02 | 0.92 | 0.00% | |
| 244.61% | 11 | 103 | 2023-10-23 | 2024-03-26 | 0.91 | 0.00% | |
| 240.90% | 17 | 75 | 2023-10-23 | 2024-03-29 | 0.91 | -0.35% | |
| 239.86% | 20 | 79 | 2023-10-23 | 2024-04-01 | 0.89 | 0.00% |
close: $5.86
pearsons cor(100-days): 0.6765
| Return Value | Short MA | Long MA | Buy Date | Sell Date | Latest Action | Sharpe Ratio | Drawdown |
|---|---|---|---|---|---|---|---|
| 172.13% | 19 | 80 | 2024-02-12 | 2024-06-14 | 1.53 | -5.92% | |
| 169.58% | 18 | 80 | 2024-02-12 | 2024-06-14 | 1.43 | -8.95% | |
| 165.77% | 15 | 65 | 2024-04-27 | 2024-06-12 | 1.64 | -3.40% | |
| 165.93% | 13 | 65 | 2024-07-26 | 2024-06-11 | buy now | 1.62 | -4.01% |
| 162.58% | 16 | 80 | 2024-02-10 | 2024-06-13 | 1.58 | -2.94% | |
| 161.06% | 11 | 125 | 2023-11-02 | 2024-06-16 | 2.03 | -0.66% | |
| 159.85% | 16 | 60 | 2024-07-26 | 2024-06-12 | buy now | 1.61 | -1.89% |
close: $1.75

pearsons cor(100-days): 0.5778
| Return Value | Short MA | Long MA | Buy Date | Sell Date | Latest Action | Sharpe Ratio | Drawdown |
|---|---|---|---|---|---|---|---|
| 203.33% | 12 | 99 | 2024-03-30 | 2024-04-02 | 1.56 | -2.88% | |
| 195.38% | 11 | 99 | 2024-03-29 | 2024-04-03 | 1.44 | -3.85% | |
| 194.61% | 17 | 98 | 2023-11-06 | 2024-03-31 | 1.57 | -2.93% | |
| 185.90% | 12 | 53 | 2024-05-30 | 2024-06-01 | 2.25 | -2.73% | |
| 184.60% | 10 | 58 | 2024-02-10 | 2024-03-22 | 2.40 | -7.30% | |
| 184.30% | 10 | 70 | 2024-03-29 | 2024-04-01 | 2.01 | -6.04% | |
| 184.91% | 14 | 99 | 2023-11-05 | 2024-03-28 | 1.33 | -8.31% |
close: $0.49
pearsons cor(100-days): 0.5543
| Return Value | Short MA | Long MA | Buy Date | Sell Date | Latest Action | Sharpe Ratio | Drawdown |
|---|---|---|---|---|---|---|---|
| 160.38% | 17 | 50 | 2024-03-06 | 2024-03-16 | 1.73 | -1.02% | |
| 155.92% | 16 | 50 | 2024-03-06 | 2024-03-16 | 1.62 | -1.96% | |
| 150.09% | 14 | 51 | 2024-03-06 | 2024-03-16 | 1.73 | -1.08% | |
| 150.09% | 15 | 50 | 2024-03-06 | 2024-03-16 | 1.73 | -1.08% | |
| 148.47% | 16 | 65 | 2024-03-12 | 2024-03-16 | 1.61 | -0.27% | |
| 148.40% | 19 | 50 | 2024-03-06 | 2024-03-16 | 1.61 | -0.13% | |
| 147.20% | 15 | 65 | 2024-03-11 | 2024-03-16 | 1.58 | -0.09% |
close: $0.00

pearsons cor(100-days):
| Return Value | Short MA | Long MA | Buy Date | Sell Date | Latest Action | Sharpe Ratio | Drawdown |
|---|---|---|---|---|---|---|---|
| 181.50% | 14 | 54 | 2023-07-22 | 2023-08-03 | 2.30 | -4.40% | |
| 160.20% | 14 | 53 | 2023-07-21 | 2023-08-03 | 1.72 | -4.40% | |
| 155.38% | 10 | 153 | 2023-03-19 | 2023-05-05 | 1.60 | -1.22% | |
| 155.80% | 11 | 68 | 2023-07-23 | 2023-07-24 | 1.61 | -3.68% | |
| 155.80% | 11 | 69 | 2023-07-23 | 2023-07-24 | 1.61 | -3.68% | |
| 150.48% | 11 | 158 | 2023-03-19 | 2023-05-06 | 1.51 | 0.00% | |
| 149.35% | 12 | 68 | 2023-03-19 | 2023-04-24 | 1.48 | 0.00% |
close: $4.71
pearsons cor(100-days): 0.7011

| Return Value | Short MA | Long MA | Buy Date | Sell Date | Latest Action | Sharpe Ratio | Drawdown |
|---|---|---|---|---|---|---|---|
| 276.59% | 14 | 50 | 2024-07-25 | 2024-06-11 | 2.15 | -2.56% | |
| 261.17% | 14 | 52 | 2024-07-25 | 2024-06-11 | 2.05 | -0.51% | |
| 251.88% | 12 | 54 | 2024-07-25 | 2024-06-10 | 1.96 | -5.97% | |
| 236.72% | 15 | 50 | 2024-07-25 | 2024-06-11 | 2.02 | -0.77% | |
| 229.97% | 12 | 55 | 2024-07-25 | 2024-06-10 | 1.95 | -3.84% | |
| 228.16% | 13 | 52 | 2024-07-25 | 2024-06-10 | 1.72 | -4.30% | |
| 224.96% | 12 | 53 | 2024-07-25 | 2024-06-10 | 1.65 | -7.66% |
close: $0.33

pearsons cor(100-days): 0.6441
| Return Value | Short MA | Long MA | Buy Date | Sell Date | Latest Action | Sharpe Ratio | Drawdown |
|---|---|---|---|---|---|---|---|
| 240.05% | 10 | 67 | 2024-02-23 | 2024-04-12 | 1.94 | -7.28% | |
| 238.73% | 10 | 65 | 2024-02-23 | 2024-04-12 | 1.93 | -7.28% | |
| 233.19% | 10 | 66 | 2024-02-23 | 2024-04-12 | 1.87 | -7.28% | |
| 209.17% | 10 | 68 | 2024-02-23 | 2024-04-12 | 1.61 | -7.28% | |
| 204.98% | 11 | 64 | 2024-02-23 | 2024-04-12 | 1.81 | -0.95% | |
| 198.85% | 11 | 65 | 2024-02-24 | 2024-04-12 | 1.73 | -0.95% | |
| 195.28% | 11 | 66 | 2024-02-24 | 2024-04-12 | 1.69 | -0.95% |
close: $0.00
pearsons cor(100-days): 0.6529
| Return Value | Short MA | Long MA | Buy Date | Sell Date | Latest Action | Sharpe Ratio | Drawdown |
|---|---|---|---|---|---|---|---|
| 196.69% | 13 | 69 | 2024-06-04 | 2024-06-10 | 2.07 | -5.14% | |
| 190.49% | 14 | 69 | 2024-06-04 | 2024-06-11 | 1.96 | -5.80% | |
| 188.55% | 10 | 96 | 2024-05-20 | 2024-05-25 | 1.29 | -2.24% | |
| 189.62% | 10 | 72 | 2024-06-04 | 2024-06-07 | 1.94 | -8.24% | |
| 183.11% | 13 | 96 | 2024-02-17 | 2024-05-18 | 1.18 | -4.85% | |
| 180.34% | 11 | 71 | 2024-06-04 | 2024-06-08 | 1.96 | -2.07% | |
| 180.60% | 11 | 96 | 2024-05-21 | 2024-05-26 | 1.19 | -3.30% |
close: $186.49
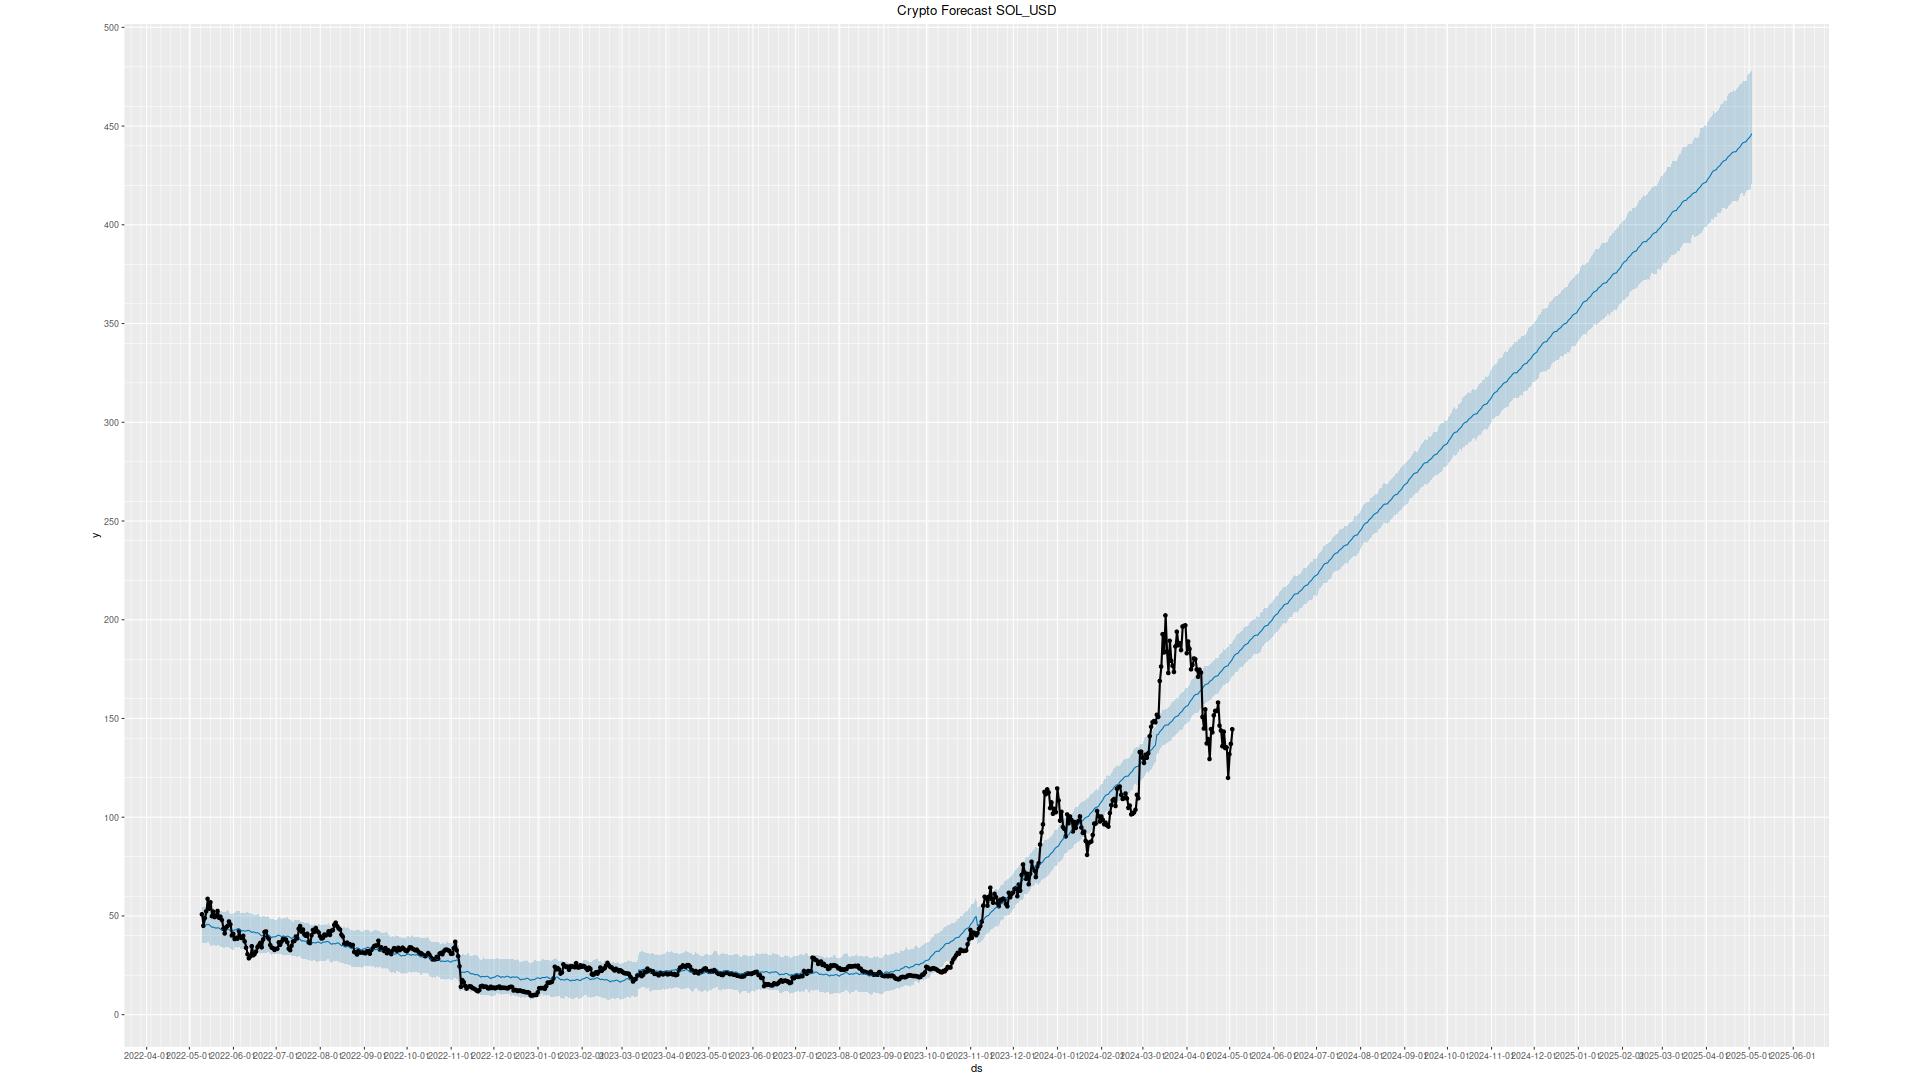
pearsons cor(100-days): 0.5759
| Return Value | Short MA | Long MA | Buy Date | Sell Date | Latest Action | Sharpe Ratio | Drawdown |
|---|---|---|---|---|---|---|---|
| 265.08% | 13 | 54 | 2024-07-19 | 2024-06-17 | 1.68 | -3.08% | |
| 245.88% | 13 | 52 | 2024-07-19 | 2024-06-17 | 1.53 | -3.73% | |
| 245.92% | 14 | 51 | 2024-07-19 | 2024-06-17 | 1.51 | -9.22% | |
| 244.63% | 13 | 51 | 2024-07-19 | 2024-06-17 | 1.50 | -7.65% | |
| 240.18% | 11 | 54 | 2024-07-19 | 2024-06-16 | 1.49 | -3.08% | |
| 240.09% | 12 | 53 | 2024-07-19 | 2024-06-16 | 1.49 | -5.34% | |
| 235.78% | 13 | 53 | 2024-07-19 | 2024-06-17 | 1.43 | -10.77% |
close: $1.52

pearsons cor(100-days): 0.6226
| Return Value | Short MA | Long MA | Buy Date | Sell Date | Latest Action | Sharpe Ratio | Drawdown |
|---|---|---|---|---|---|---|---|
| 196.32% | 12 | 85 | 2024-04-29 | 2024-04-30 | 2.42 | -2.91% | |
| 178.71% | 10 | 85 | 2024-04-23 | 2024-04-30 | 1.89 | -4.54% | |
| 172.57% | 19 | 68 | 2024-02-23 | 2024-04-22 | 2.03 | -2.17% | |
| 166.55% | 13 | 55 | 2024-05-27 | 2024-06-07 | 1.77 | -5.58% | |
| 166.21% | 15 | 51 | 2024-05-28 | 2024-06-07 | 1.83 | -6.06% | |
| 162.95% | 15 | 54 | 2024-05-28 | 2024-06-08 | 1.97 | -5.28% | |
| 162.44% | 14 | 55 | 2024-05-28 | 2024-06-07 | 1.71 | -4.14% |
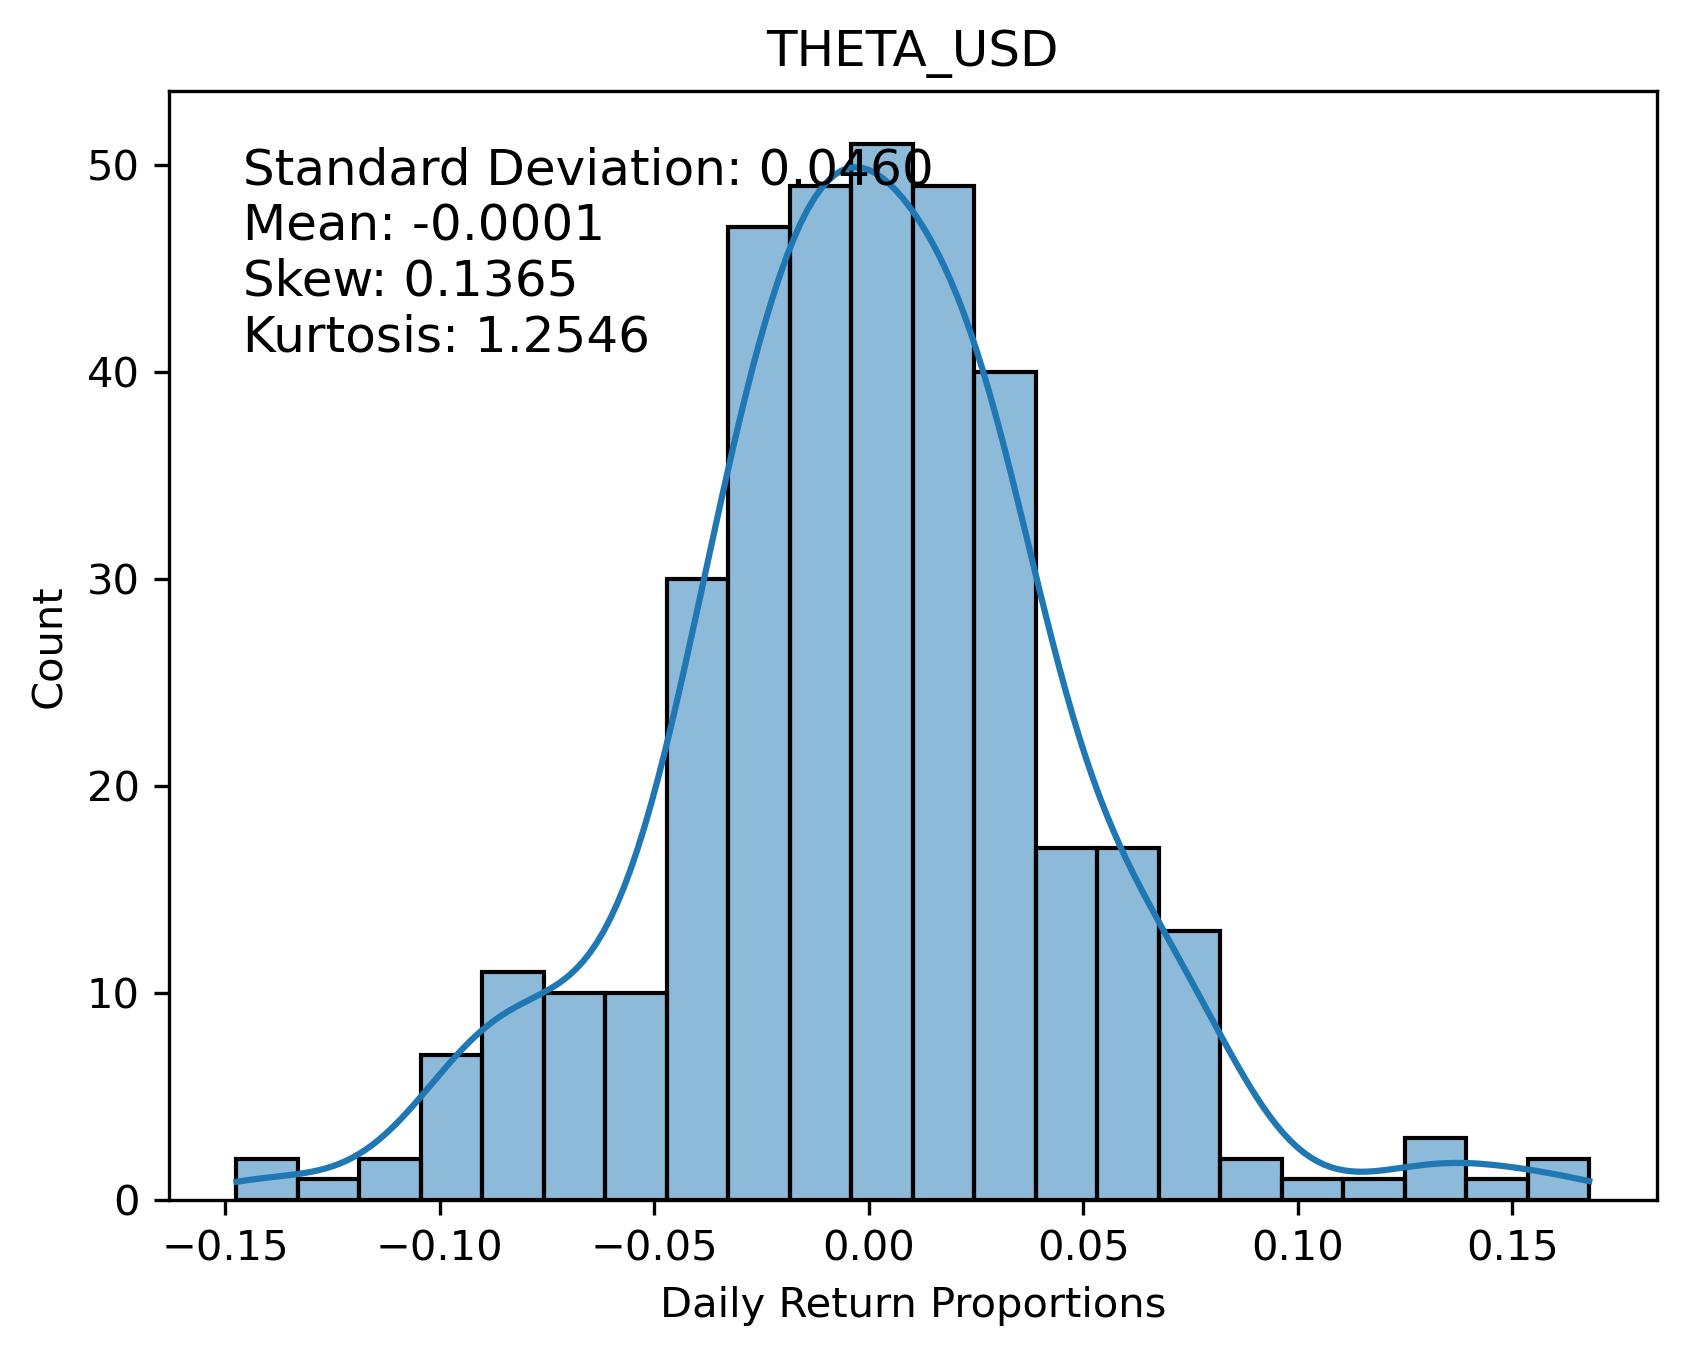
close: $7.73
pearsons cor(100-days): 0.2827
| Return Value | Short MA | Long MA | Buy Date | Sell Date | Latest Action | Sharpe Ratio | Drawdown |
|---|---|---|---|---|---|---|---|
| 193.79% | 14 | 64 | 2024-05-27 | 2024-07-04 | 2.06 | -1.54% | |
| 190.10% | 14 | 57 | 2024-05-26 | 2024-07-03 | 2.18 | -1.02% | |
| 188.32% | 15 | 60 | 2024-05-27 | 2024-07-04 | 1.94 | -1.54% | |
| 188.22% | 13 | 64 | 2024-05-27 | 2024-07-04 | 1.95 | -1.54% | |
| 187.62% | 13 | 63 | 2024-05-27 | 2024-07-04 | 1.98 | -2.00% | |
| 187.51% | 21 | 85 | 2024-06-04 | 2024-07-10 | 1.79 | -1.87% | |
| 187.14% | 15 | 55 | 2024-05-26 | 2024-07-03 | 2.02 | -2.00% |
close: $0.10
pearsons cor(100-days): 0.6320
| Return Value | Short MA | Long MA | Buy Date | Sell Date | Latest Action | Sharpe Ratio | Drawdown |
|---|---|---|---|---|---|---|---|
| 157.11% | 19 | 53 | 2024-07-22 | 2024-04-12 | 1.60 | -3.10% | |
| 153.77% | 12 | 88 | 2024-07-21 | 2024-04-15 | 1.86 | -1.43% | |
| 153.22% | 19 | 64 | 2024-07-24 | 2024-04-15 | 1.77 | -2.76% | |
| 151.69% | 12 | 117 | 2024-03-01 | 2024-04-15 | 1.89 | -0.47% | |
| 151.90% | 12 | 86 | 2024-07-21 | 2024-04-15 | 1.84 | -1.43% | |
| 151.92% | 11 | 87 | 2024-07-21 | 2024-04-15 | 1.78 | -3.96% | |
| 150.52% | 11 | 88 | 2024-07-21 | 2024-04-15 | 1.73 | -3.96% |
close: $0.60
pearsons cor(100-days): 0.5703
| Return Value | Short MA | Long MA | Buy Date | Sell Date | Latest Action | Sharpe Ratio | Drawdown |
|---|---|---|---|---|---|---|---|
| 323.68% | 14 | 92 | 2024-07-19 | 2024-04-15 | 1.49 | -1.20% | |
| 307.52% | 14 | 70 | 2024-07-19 | 2024-04-13 | 1.44 | -1.56% | |
| 304.88% | 14 | 62 | 2024-07-19 | 2024-04-12 | 1.43 | -0.76% | |
| 301.24% | 16 | 56 | 2024-07-20 | 2024-06-09 | 1.33 | -7.13% | |
| 296.25% | 10 | 54 | 2024-07-16 | 2024-06-07 | 1.34 | -3.44% | |
| 292.17% | 14 | 63 | 2024-07-19 | 2024-04-12 | 1.36 | -1.92% | |
| 291.30% | 14 | 67 | 2024-07-19 | 2024-04-13 | 1.37 | -0.47% |