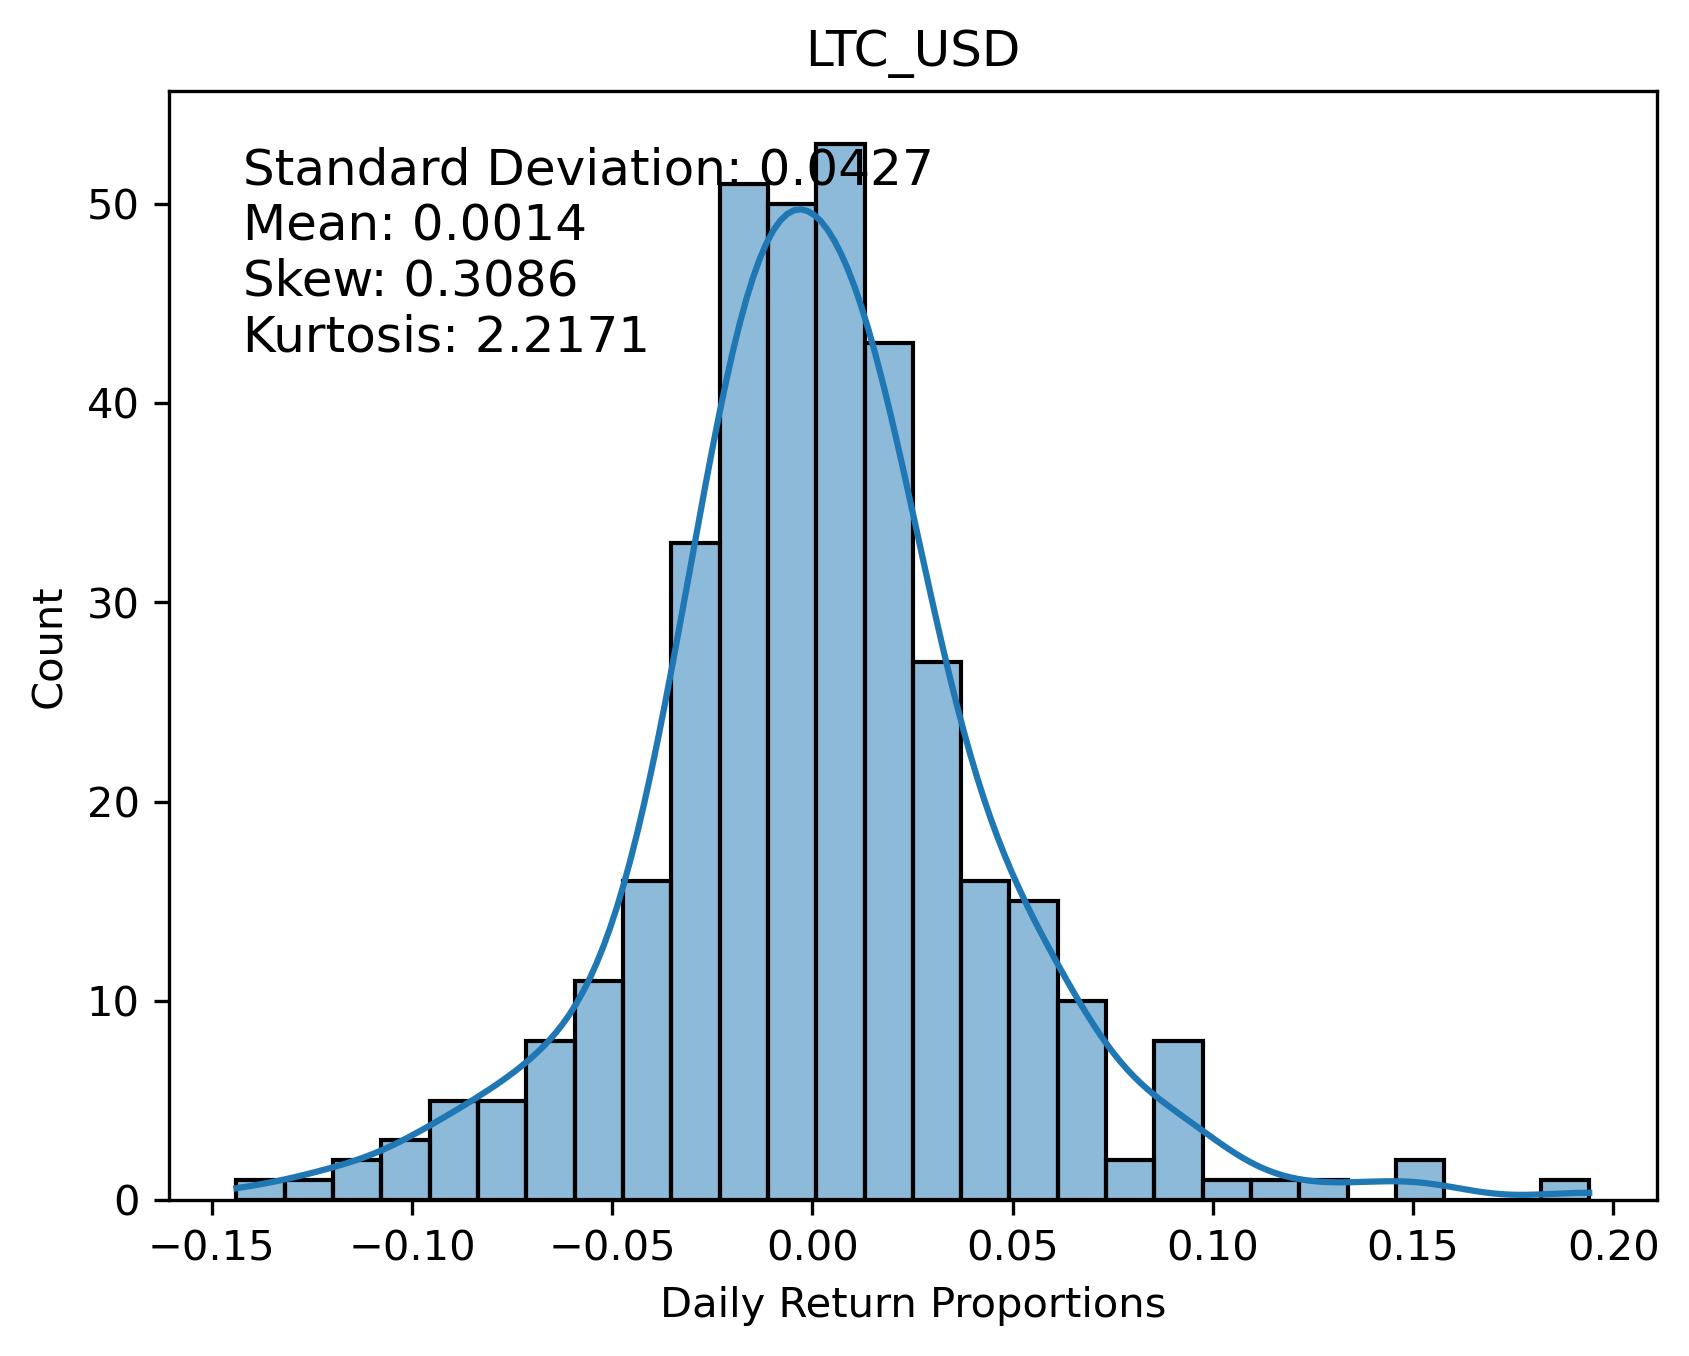
close: $94.81


pearsons cor(100-days): 0.6488
| Return Value | Short MA | Long MA | Buy Date | Sell Date | Latest Action | Sharpe Ratio | Drawdown |
|---|---|---|---|---|---|---|---|
| 229.68% | 11 | 107 | 2024-02-27 | 2024-04-17 | 2.58 | -3.30% | |
| 215.48% | 11 | 106 | 2024-02-27 | 2024-04-17 | 2.39 | -3.30% | |
| 197.74% | 10 | 50 | 2024-02-23 | 2024-04-12 | 2.02 | -5.53% | |
| 196.43% | 10 | 52 | 2024-02-23 | 2024-04-12 | 1.90 | -4.94% | |
| 194.40% | 10 | 92 | 2024-02-28 | 2024-04-17 | 2.00 | -2.70% | |
| 192.20% | 12 | 102 | 2024-02-28 | 2024-04-17 | 2.20 | -4.94% | |
| 191.15% | 11 | 105 | 2024-02-27 | 2024-04-17 | 1.87 | -8.89% |
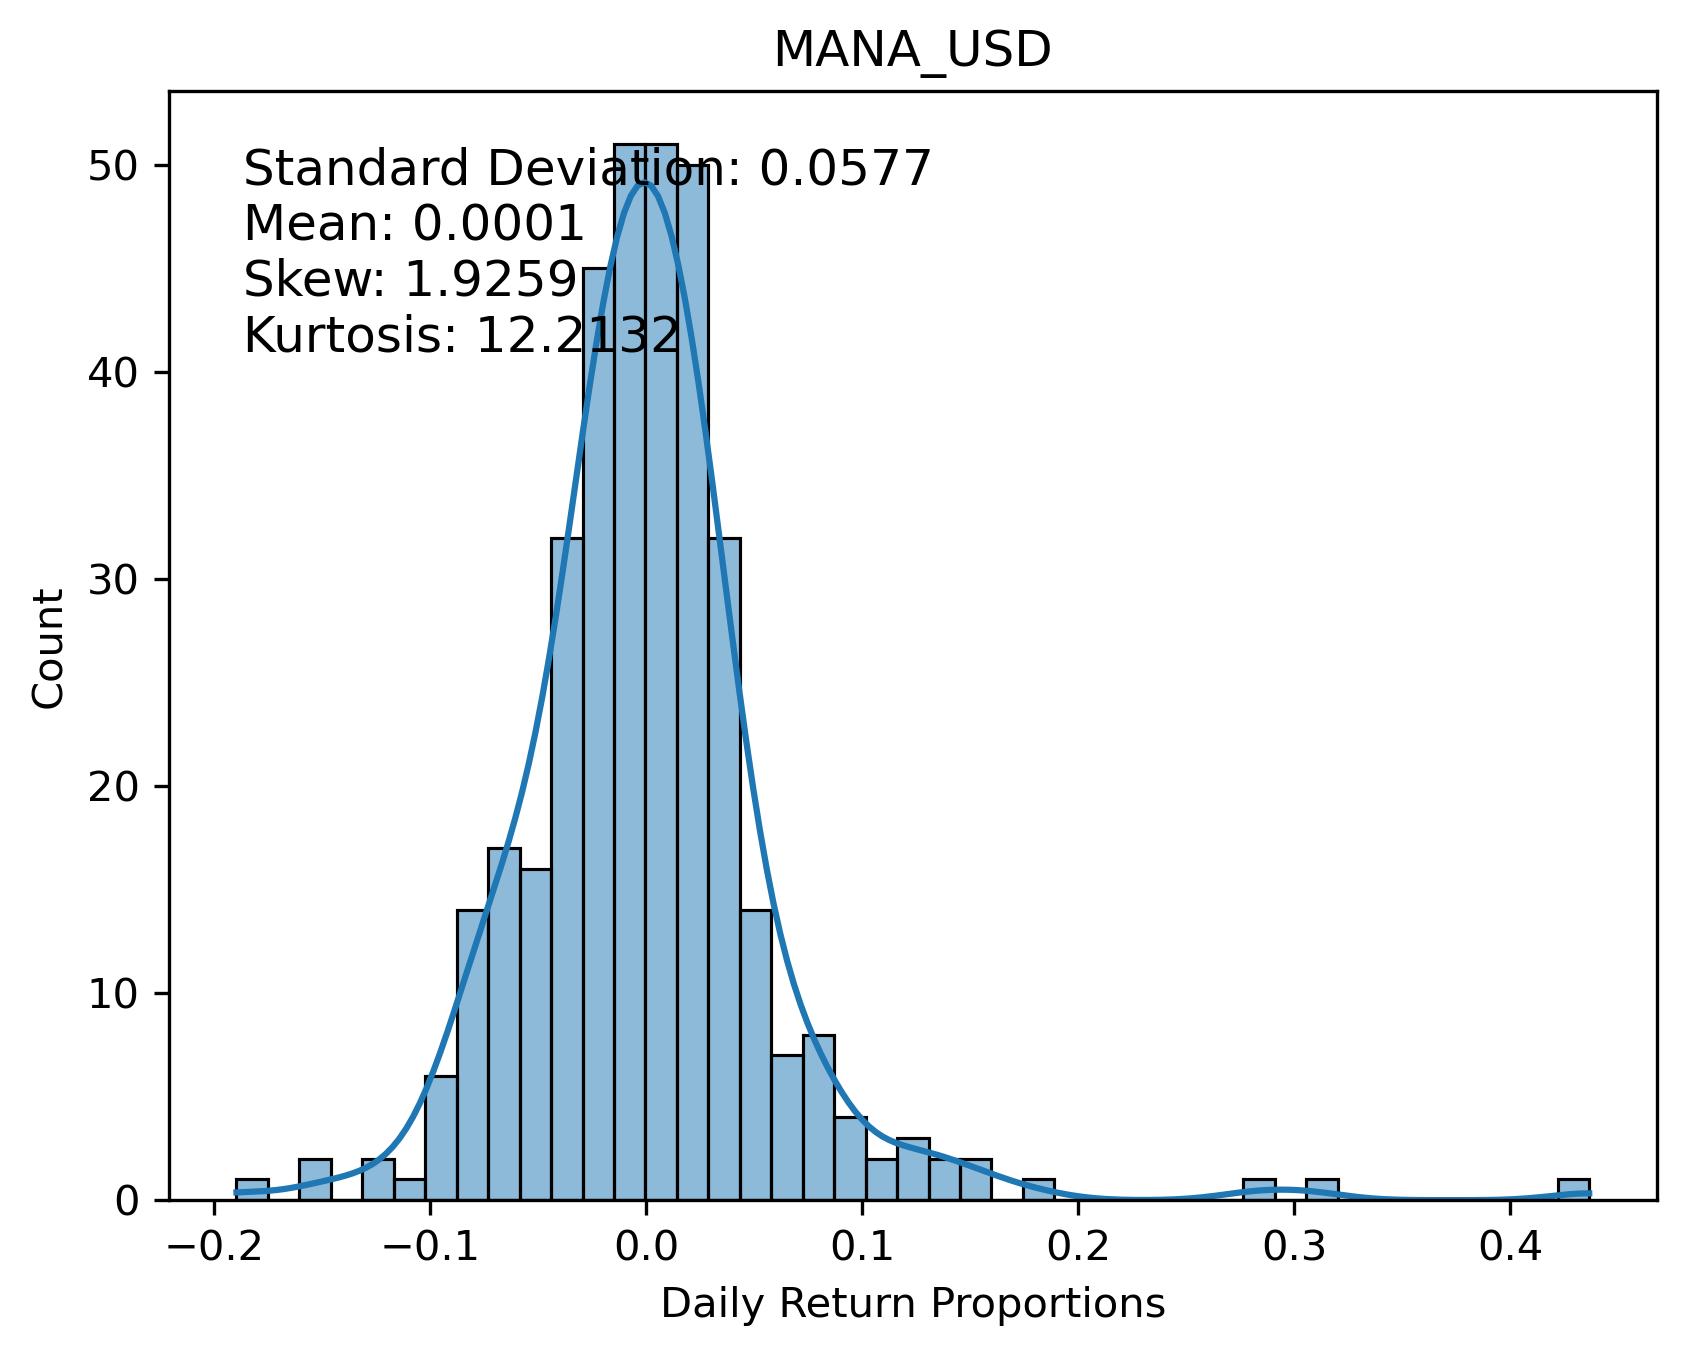
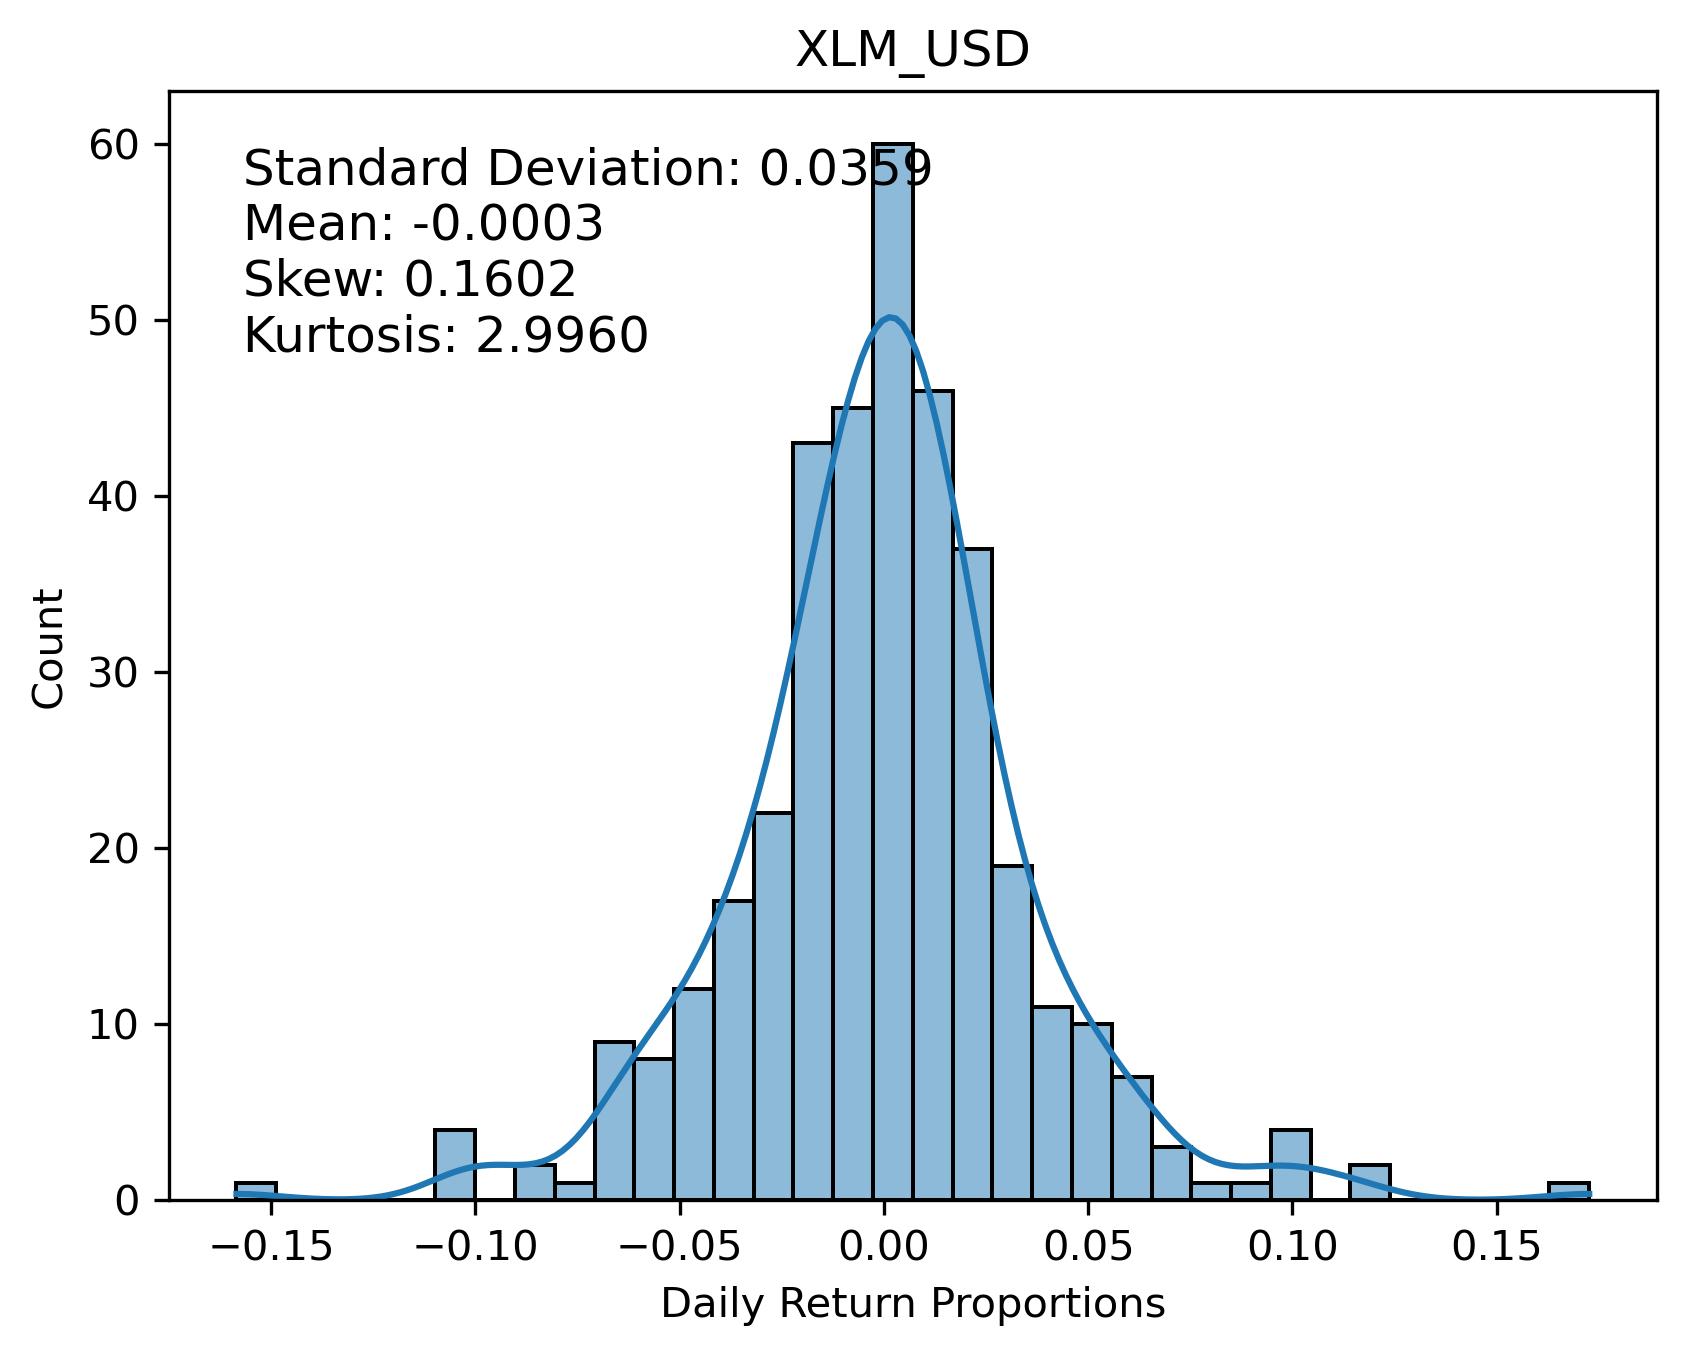
close: $0.51


pearsons cor(100-days): 0.7669
| Return Value | Short MA | Long MA | Buy Date | Sell Date | Latest Action | Sharpe Ratio | Drawdown |
|---|---|---|---|---|---|---|---|
| 179.27% | 13 | 194 | 2023-11-04 | 2024-04-20 | 1.69 | -2.19% | |
| 166.21% | 16 | 89 | 2024-02-10 | 2024-04-12 | 1.97 | -1.17% | |
| 158.00% | 16 | 92 | 2024-02-08 | 2024-04-12 | 1.87 | -1.80% | |
| 151.98% | 11 | 199 | 2023-11-04 | 2024-04-19 | 1.17 | -7.57% | |
| 149.50% | 16 | 88 | 2024-02-10 | 2024-04-12 | 1.63 | -2.60% | |
| 149.41% | 16 | 94 | 2024-02-07 | 2024-04-12 | 1.61 | -3.10% | |
| 149.13% | 13 | 193 | 2023-11-04 | 2024-04-20 | 1.16 | -2.64% |
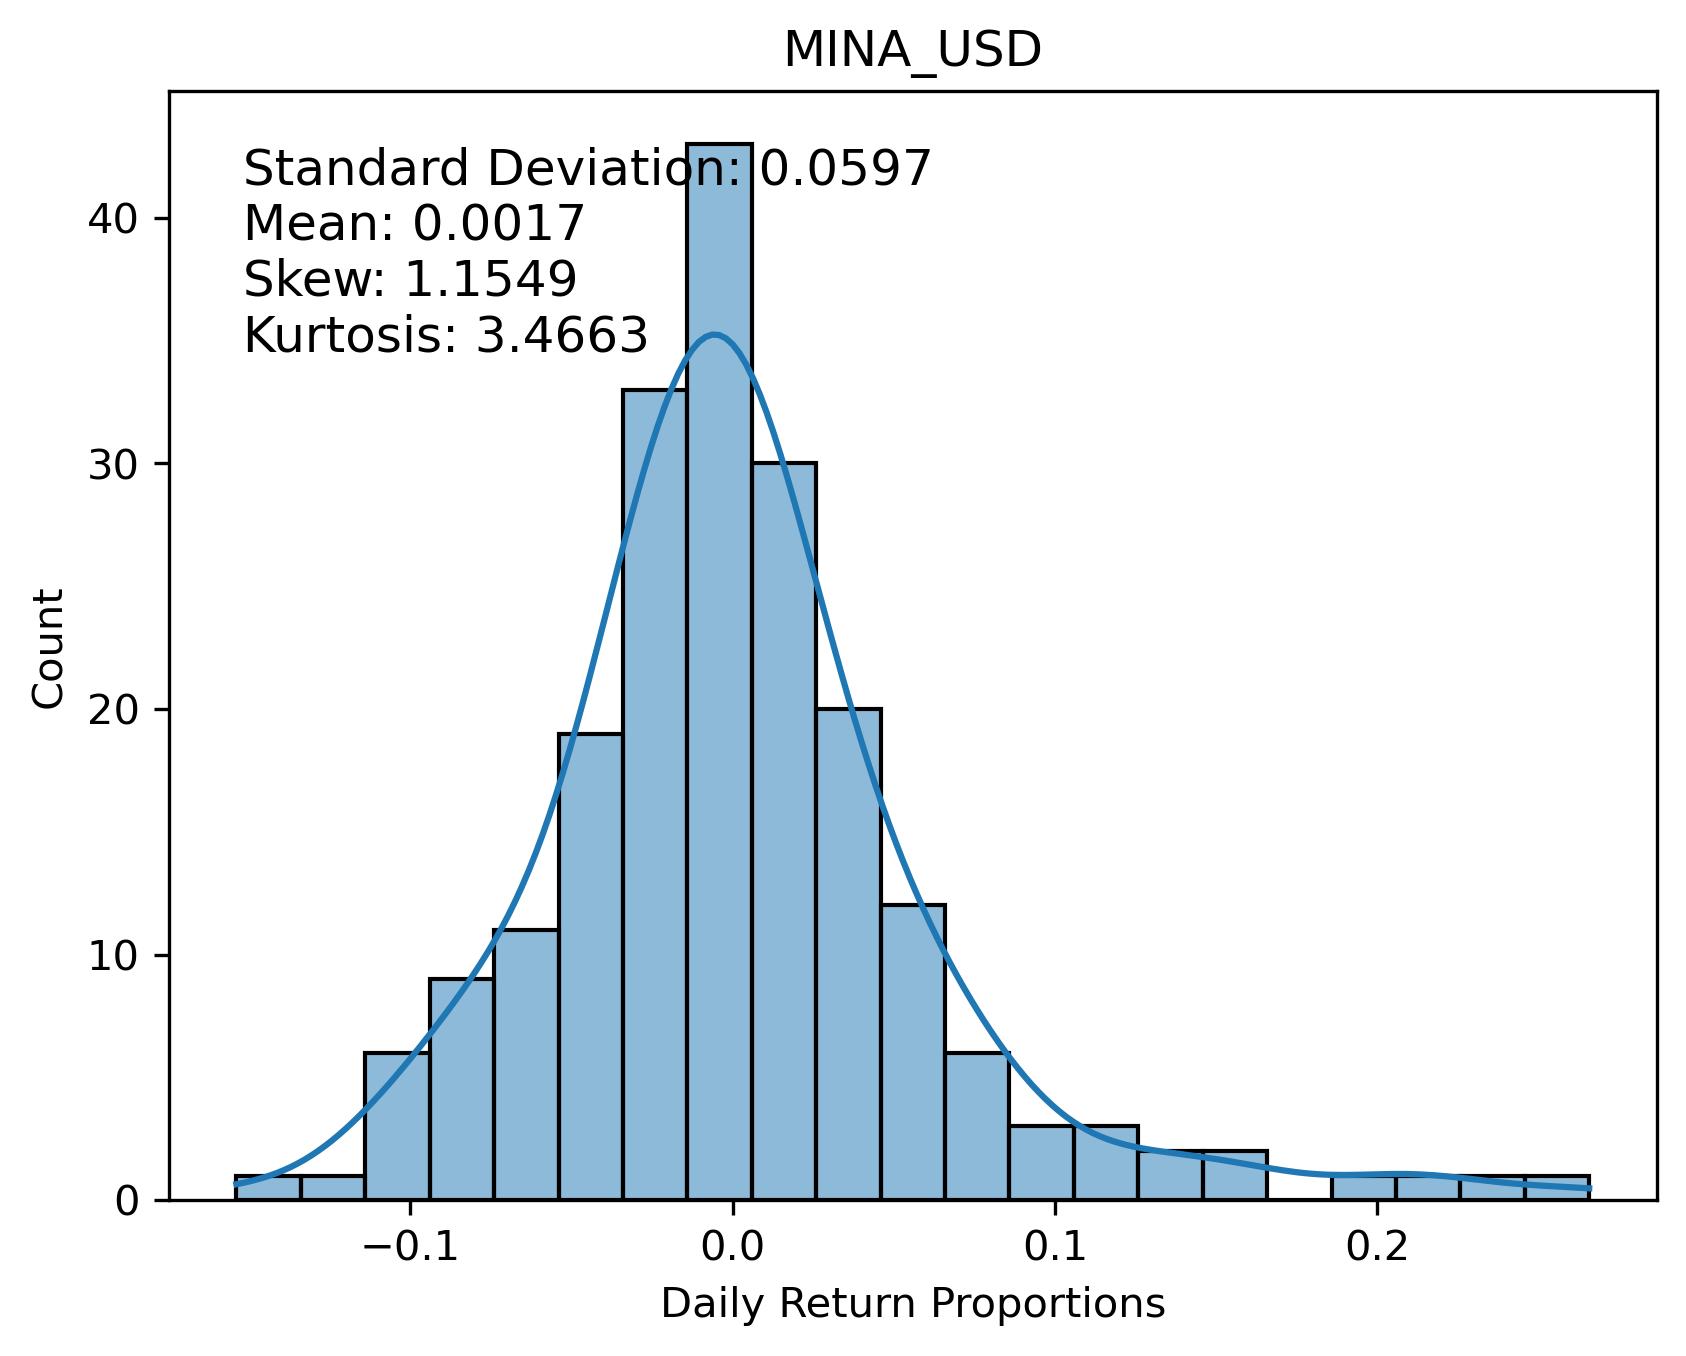
close: $1.32


pearsons cor(100-days): 0.7301
| Return Value | Short MA | Long MA | Buy Date | Sell Date | Latest Action | Sharpe Ratio | Drawdown |
|---|---|---|---|---|---|---|---|
| 179.78% | 13 | 94 | 2024-02-19 | 2024-04-12 | 1.75 | -0.90% | |
| 168.25% | 14 | 129 | 2024-02-17 | 2024-04-12 | 1.52 | -0.08% | |
| 167.33% | 14 | 128 | 2024-02-17 | 2024-04-12 | 1.50 | -0.08% | |
| 163.39% | 14 | 97 | 2024-02-19 | 2024-04-12 | 1.52 | -2.43% | |
| 160.88% | 13 | 57 | 2024-02-17 | 2024-04-04 | 2.01 | -2.52% | |
| 160.28% | 14 | 98 | 2024-02-19 | 2024-04-12 | 1.49 | -0.46% | |
| 159.69% | 12 | 56 | 2024-02-17 | 2024-04-04 | 1.97 | -1.44% |
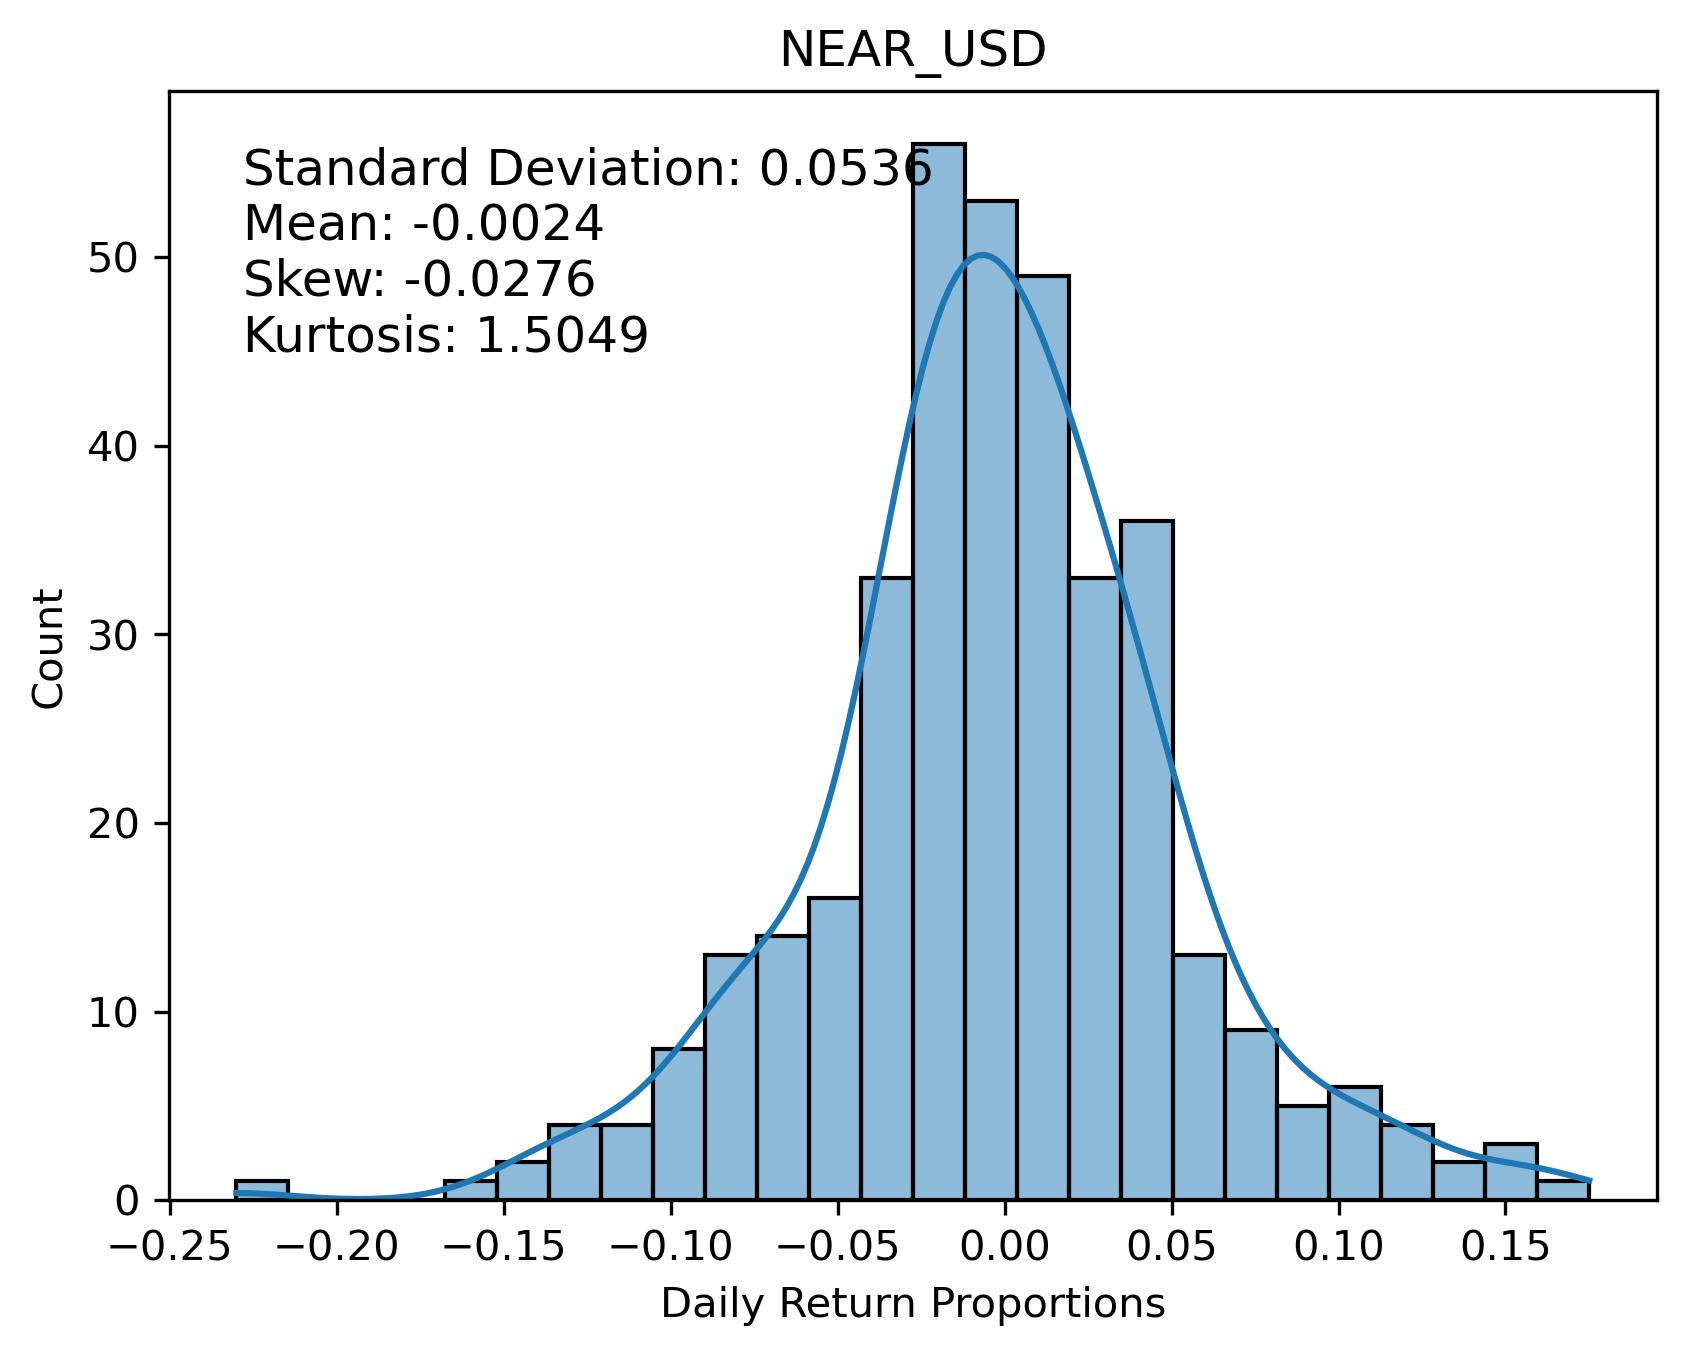
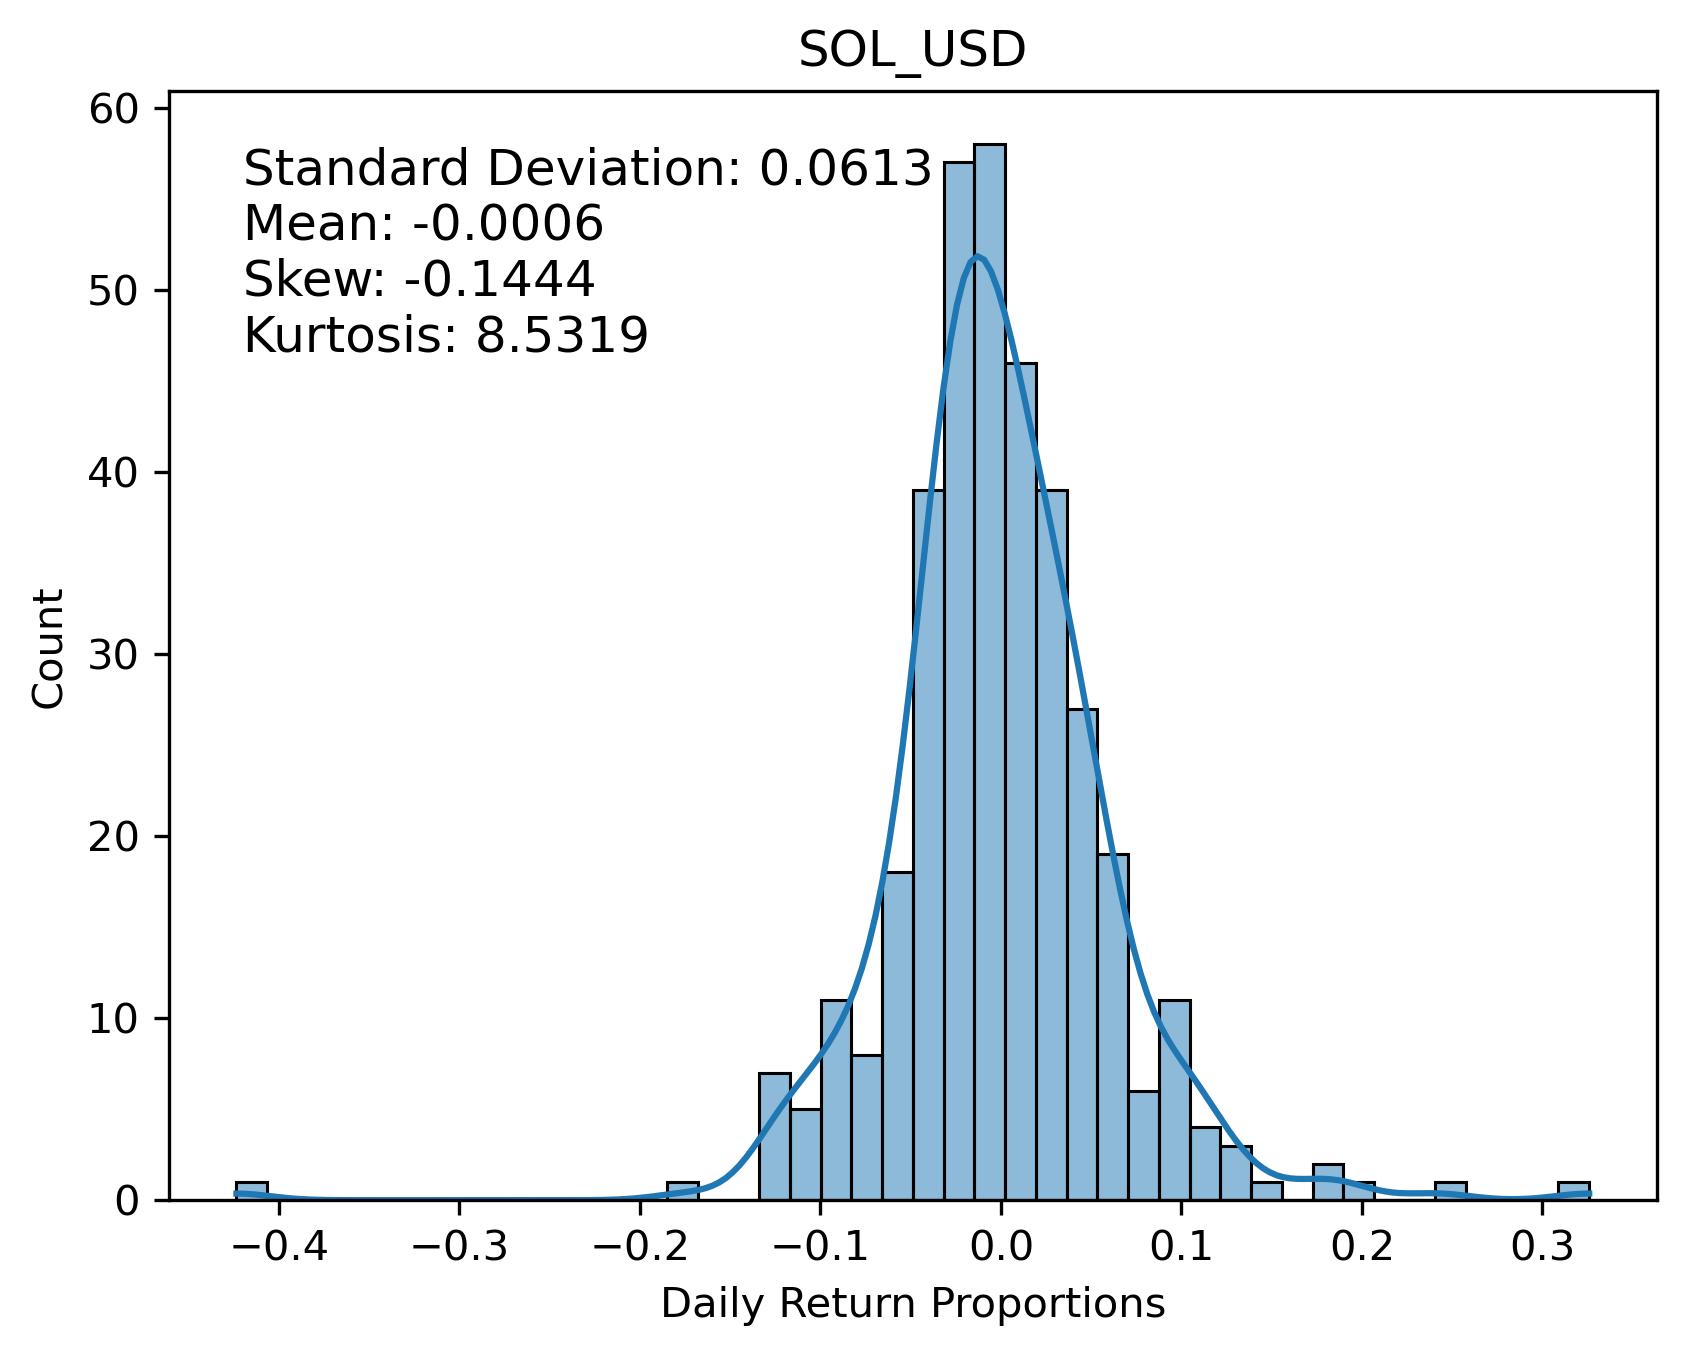
close: $9.85


pearsons cor(100-days): 0.6367
| Return Value | Short MA | Long MA | Buy Date | Sell Date | Latest Action | Sharpe Ratio | Drawdown |
|---|---|---|---|---|---|---|---|
| 179.19% | 13 | 53 | 2024-02-17 | 2024-04-12 | 1.88 | -2.25% | |
| 157.07% | 10 | 65 | 2024-02-14 | 2024-04-13 | 1.70 | -3.66% | |
| 157.07% | 10 | 66 | 2024-02-14 | 2024-04-13 | 1.70 | -3.66% | |
| 156.80% | 18 | 92 | 2023-10-30 | 2024-04-19 | 0.86 | -2.52% | |
| 156.80% | 17 | 92 | 2023-10-30 | 2024-04-19 | 0.86 | -2.52% | |
| 157.56% | 12 | 54 | 2024-02-17 | 2024-04-12 | 1.44 | -6.53% | |
| 155.17% | 10 | 61 | 2024-02-15 | 2024-04-12 | 1.38 | -5.09% |
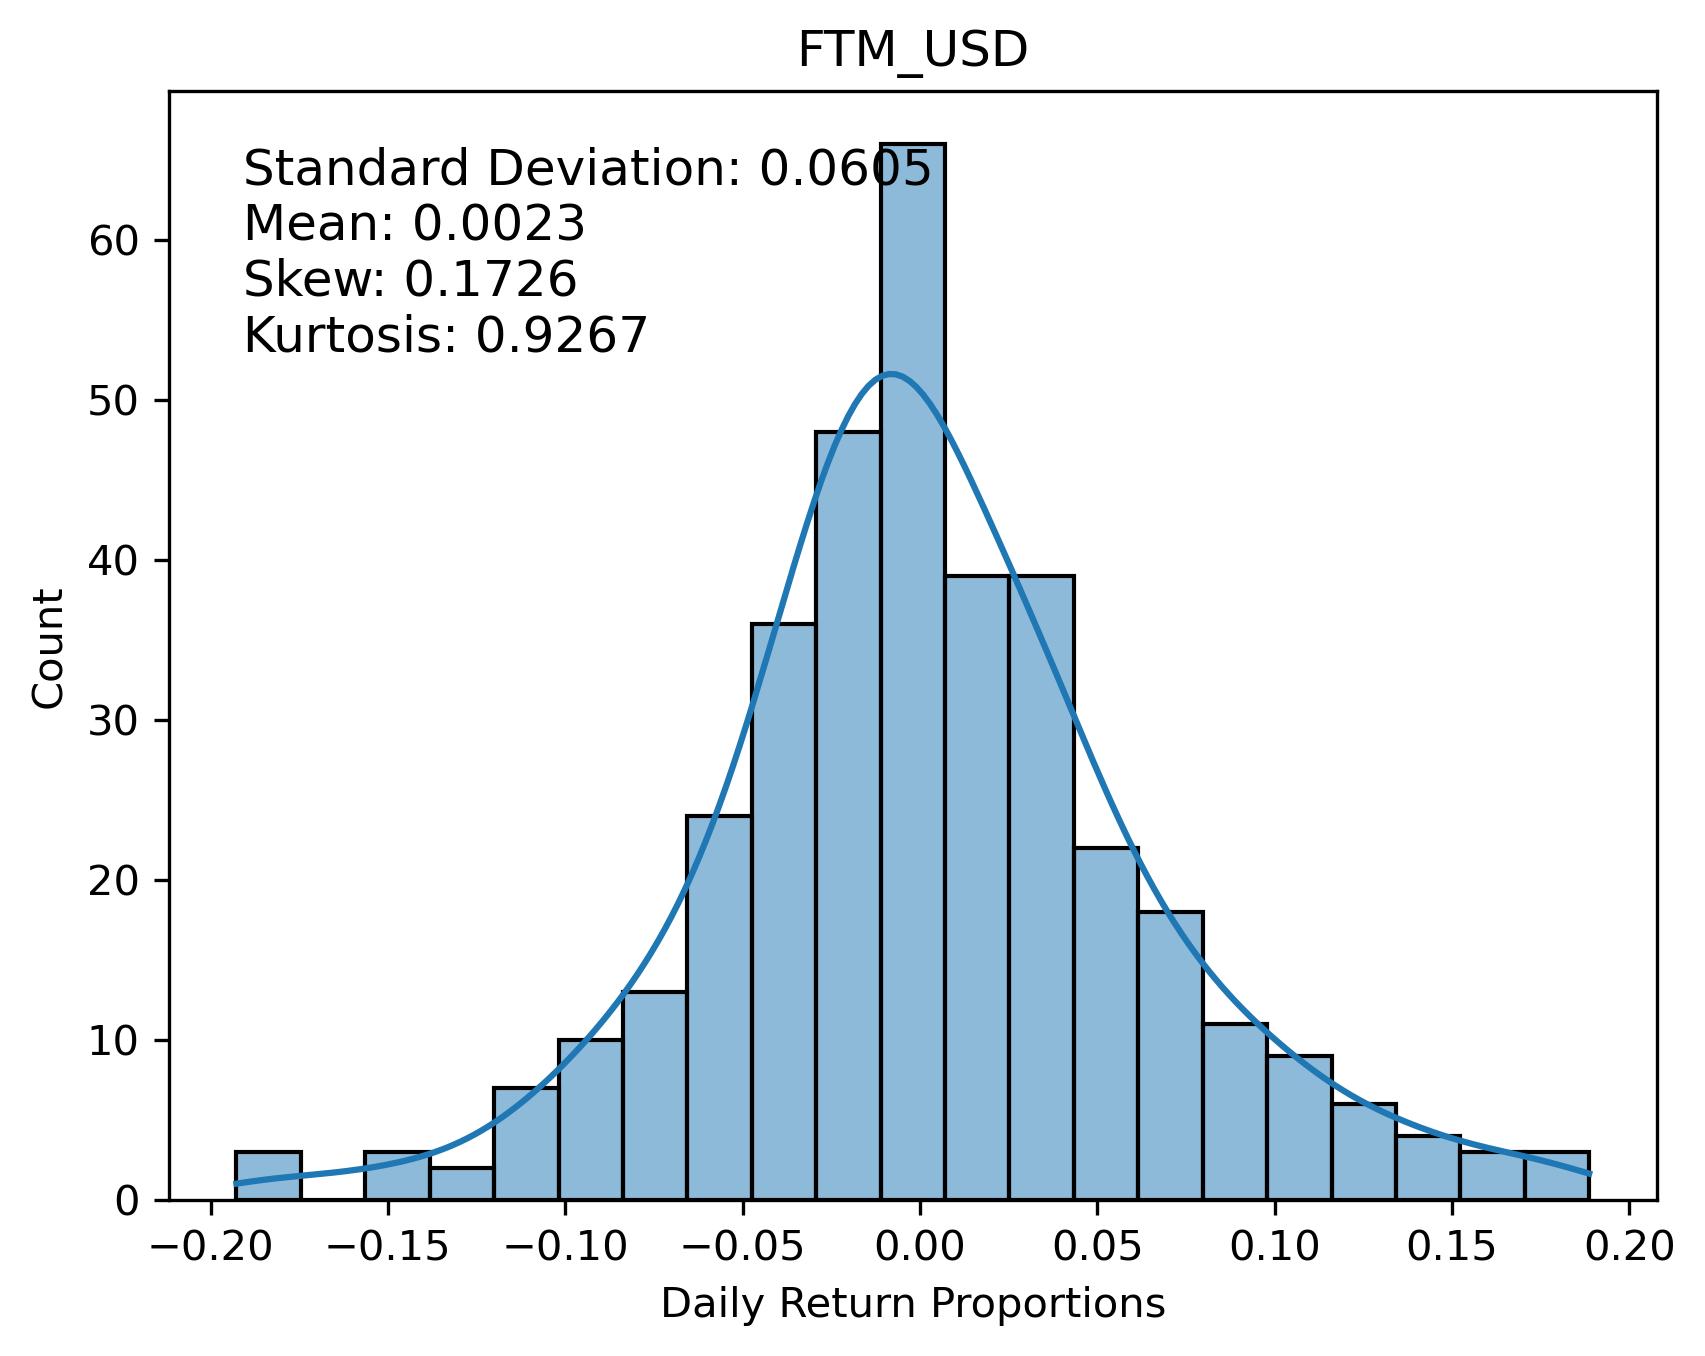
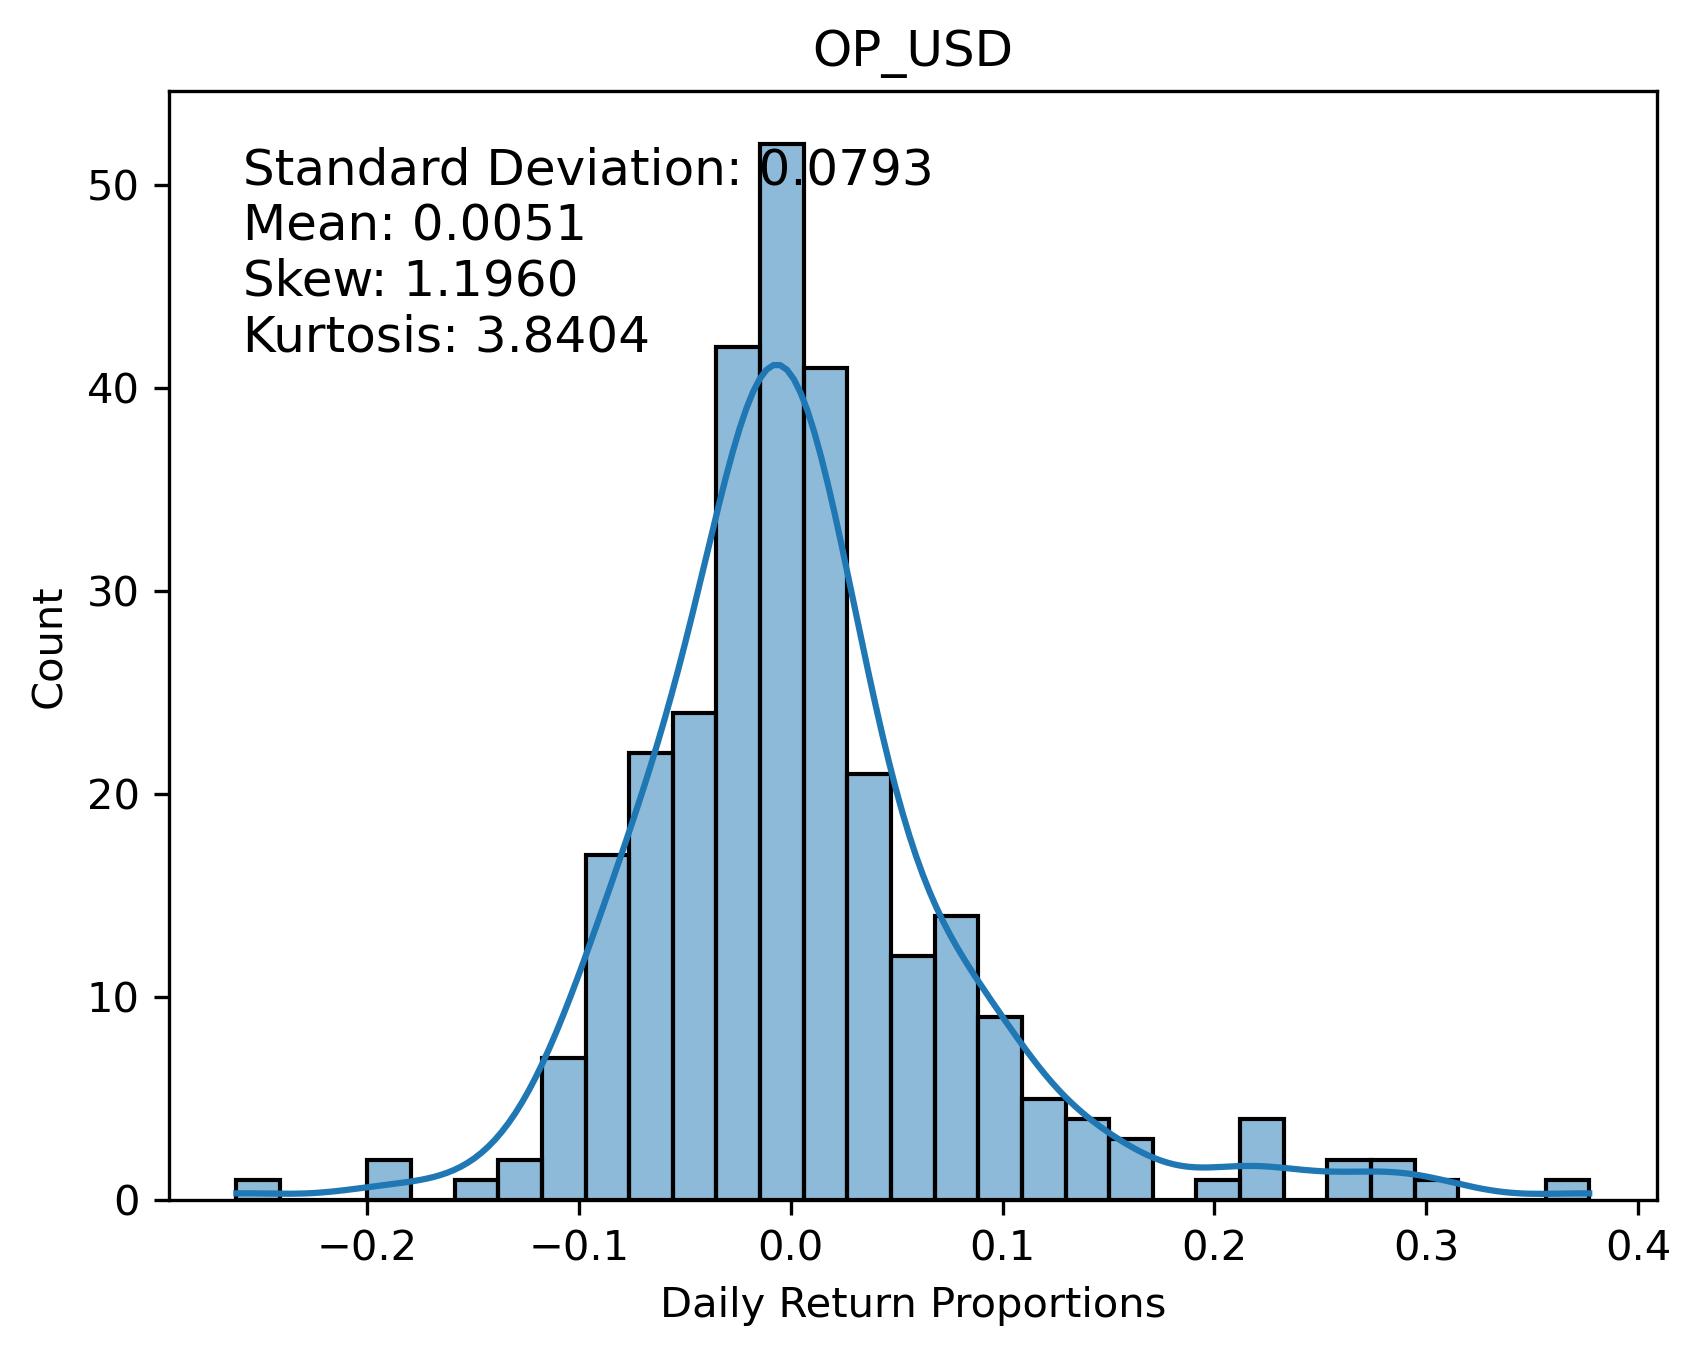
close: $1.18


pearsons cor(100-days): 0.0936
| Return Value | Short MA | Long MA | Buy Date | Sell Date | Latest Action | Sharpe Ratio | Drawdown |
|---|---|---|---|---|---|---|---|
| 136.93% | 10 | 197 | 2023-12-01 | 2024-04-12 | 1.79 | 0.00% | |
| 133.94% | 10 | 193 | 2023-11-30 | 2024-04-12 | 1.65 | 0.00% | |
| 131.34% | 10 | 198 | 2023-12-01 | 2024-04-12 | 1.53 | 0.00% | |
| 131.34% | 10 | 199 | 2023-12-01 | 2024-04-12 | 1.53 | 0.00% | |
| 131.34% | 10 | 200 | 2023-12-01 | 2024-04-12 | 1.53 | 0.00% | |
| 129.18% | 10 | 196 | 2023-12-01 | 2024-04-12 | 1.45 | 0.00% | |
| 129.18% | 10 | 194 | 2023-12-01 | 2024-04-12 | 1.45 | 0.00% |
close: $8.77


pearsons cor(100-days): 0.6758
| Return Value | Short MA | Long MA | Buy Date | Sell Date | Latest Action | Sharpe Ratio | Drawdown |
|---|---|---|---|---|---|---|---|
| 240.10% | 17 | 67 | 2024-02-23 | 2024-04-12 | 2.09 | -1.16% | |
| 230.99% | 17 | 68 | 2024-02-24 | 2024-04-12 | 1.99 | -1.90% | |
| 208.95% | 17 | 66 | 2024-02-23 | 2024-04-11 | 1.85 | -1.16% | |
| 197.35% | 17 | 69 | 2024-02-24 | 2024-04-12 | 1.56 | -8.05% | |
| 173.67% | 15 | 70 | 2024-02-23 | 2024-04-12 | 2.09 | 0.00% | |
| 172.16% | 14 | 72 | 2024-02-23 | 2024-04-12 | 1.87 | -2.02% | |
| 169.99% | 12 | 72 | 2024-02-23 | 2024-04-10 | 1.92 | -1.34% |
close: $38.29


pearsons cor(100-days): 0.6875
| Return Value | Short MA | Long MA | Buy Date | Sell Date | Latest Action | Sharpe Ratio | Drawdown |
|---|---|---|---|---|---|---|---|
| 219.59% | 12 | 59 | 2024-02-14 | 2024-04-12 | 2.12 | -3.88% | |
| 216.18% | 12 | 58 | 2024-02-14 | 2024-04-12 | 2.07 | -3.88% | |
| 200.23% | 12 | 60 | 2024-02-14 | 2024-04-12 | 2.15 | -3.64% | |
| 197.51% | 13 | 58 | 2024-02-14 | 2024-04-13 | 2.23 | 0.00% | |
| 189.79% | 13 | 57 | 2024-02-14 | 2024-04-12 | 1.79 | -4.59% | |
| 179.04% | 11 | 60 | 2024-02-14 | 2024-04-12 | 1.58 | -5.88% | |
| 175.59% | 13 | 56 | 2024-02-14 | 2024-04-12 | 1.51 | -5.39% |
close: $7.60


pearsons cor(100-days): 0.7142

| Return Value | Short MA | Long MA | Buy Date | Sell Date | Latest Action | Sharpe Ratio | Drawdown |
|---|---|---|---|---|---|---|---|
| 180.44% | 19 | 53 | 2024-02-23 | 2024-04-12 | 1.78 | -3.42% | |
| 178.45% | 20 | 50 | 2024-02-22 | 2024-04-11 | 1.90 | -2.36% | |
| 177.29% | 14 | 64 | 2024-02-24 | 2024-04-12 | 1.76 | -0.31% | |
| 176.96% | 13 | 66 | 2024-02-21 | 2024-04-12 | 1.63 | -1.52% | |
| 173.34% | 20 | 52 | 2024-02-23 | 2024-04-12 | 1.68 | -3.04% | |
| 171.26% | 10 | 69 | 2024-02-18 | 2024-04-12 | 1.72 | -0.80% | |
| 171.80% | 15 | 53 | 2024-02-20 | 2024-04-11 | 2.00 | -4.97% |
close: $66.01K


pearsons cor(100-days): 0.7867
| Return Value | Short MA | Long MA | Buy Date | Sell Date | Latest Action | Sharpe Ratio | Drawdown |
|---|---|---|---|---|---|---|---|
| 141.26% | 14 | 50 | 2024-02-08 | 2024-04-17 | 2.00 | -2.92% | |
| 140.83% | 12 | 88 | 2023-10-16 | 2023-08-19 | 1.41 | -1.73% | |
| 140.95% | 11 | 88 | 2023-10-16 | 2023-08-19 | 1.41 | -2.20% | |
| 138.64% | 12 | 54 | 2024-02-07 | 2024-04-19 | 2.25 | -0.96% | |
| 139.01% | 11 | 61 | 2024-02-07 | 2024-04-21 | 1.93 | -1.57% | |
| 138.48% | 13 | 53 | 2024-02-08 | 2024-04-19 | 2.23 | -0.96% | |
| 137.98% | 17 | 50 | 2024-02-10 | 2024-04-17 | 1.91 | -1.78% |
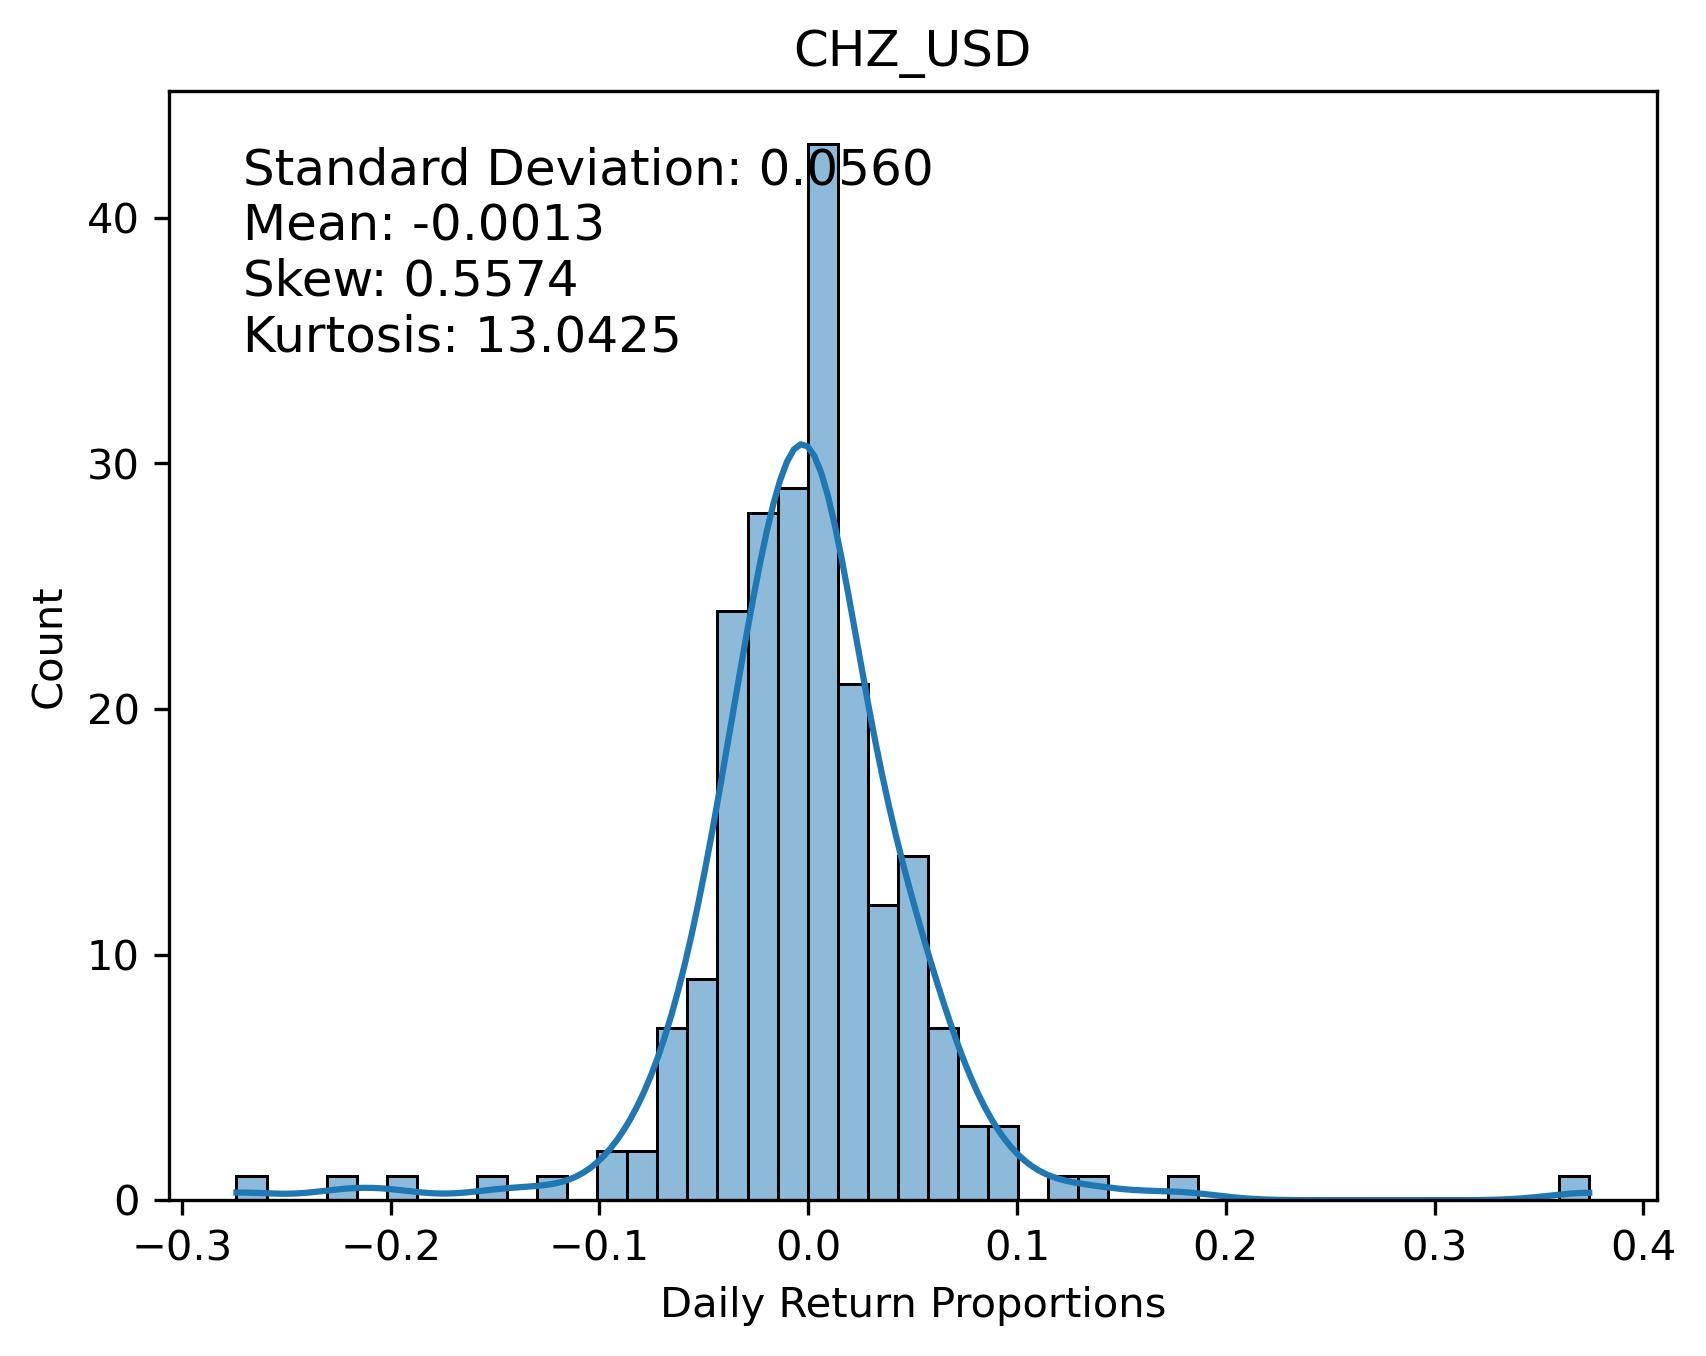
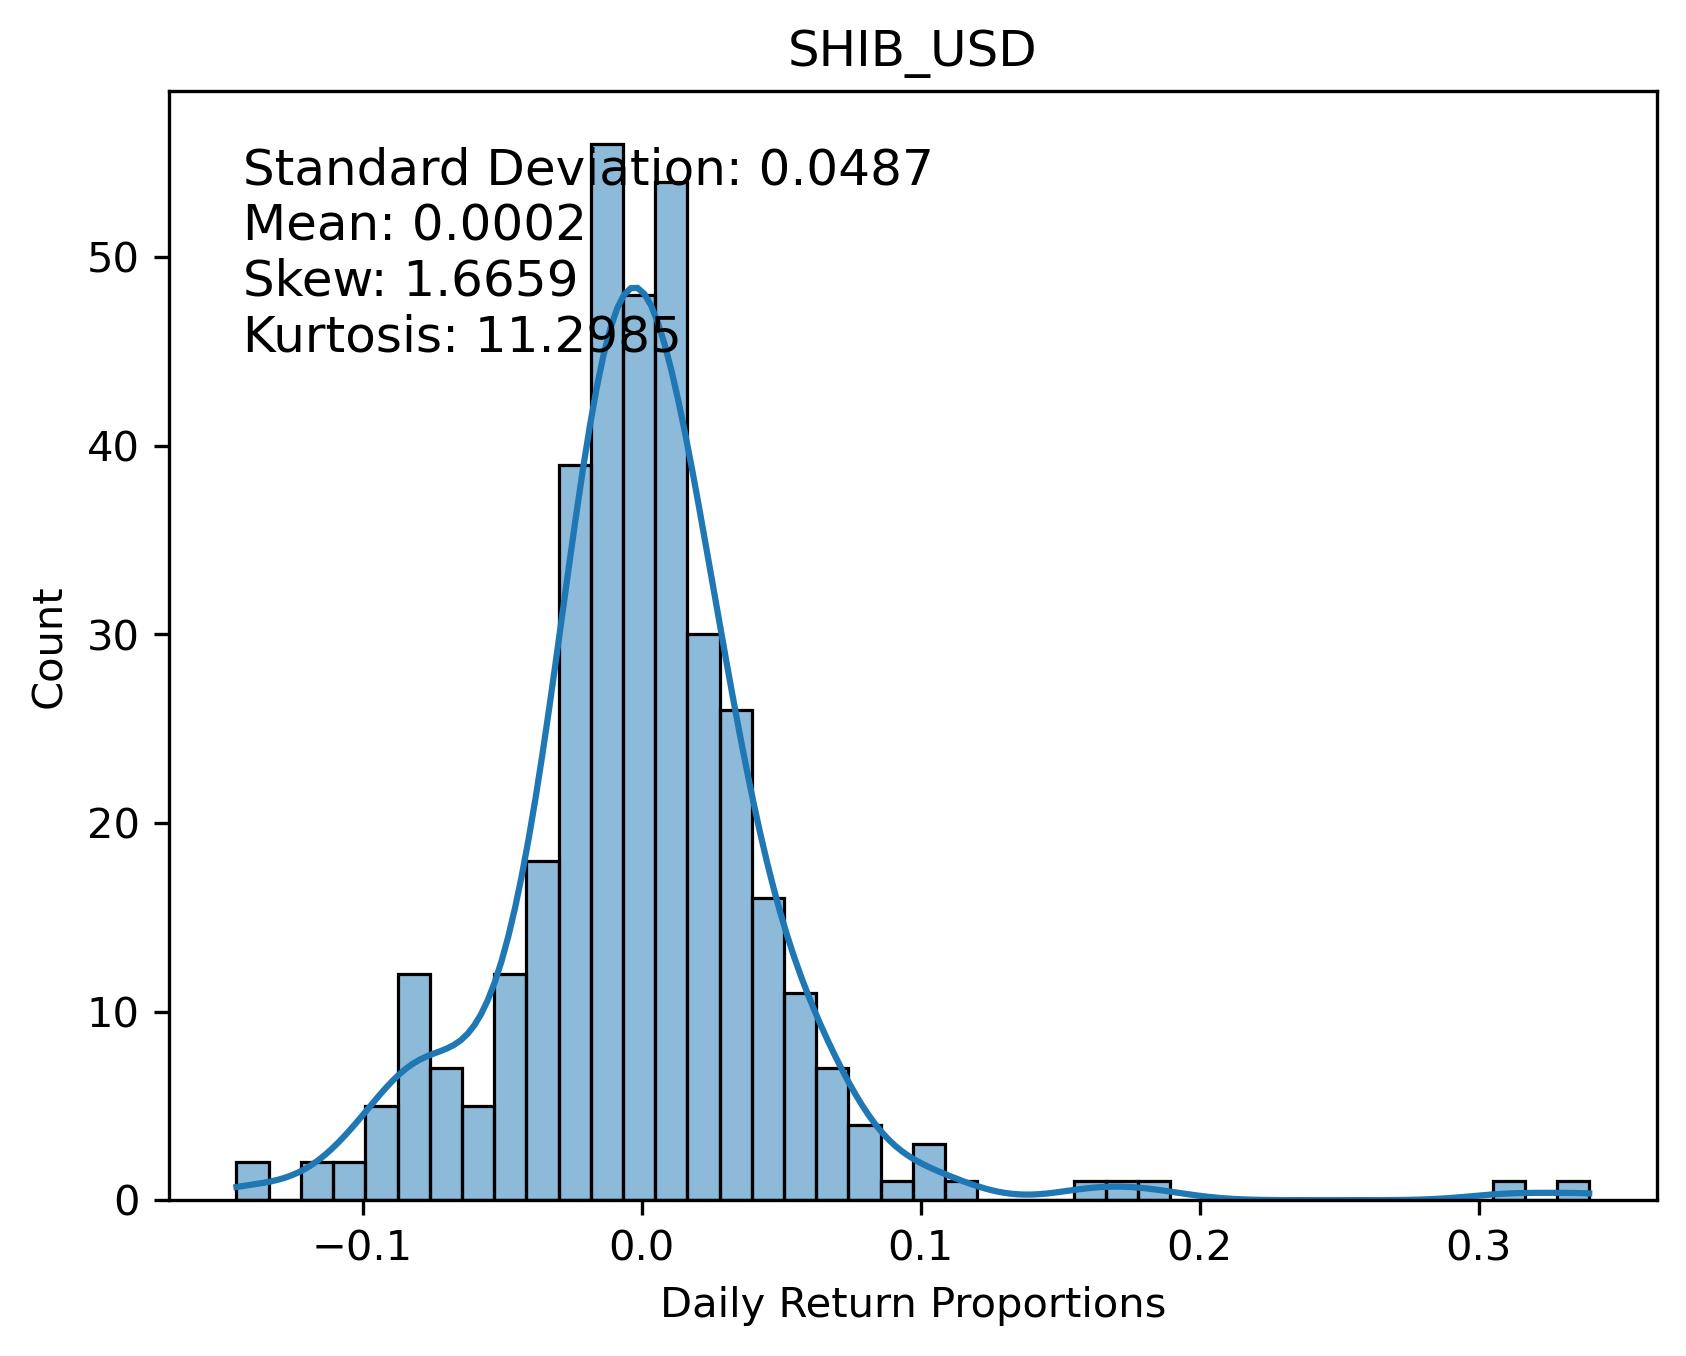
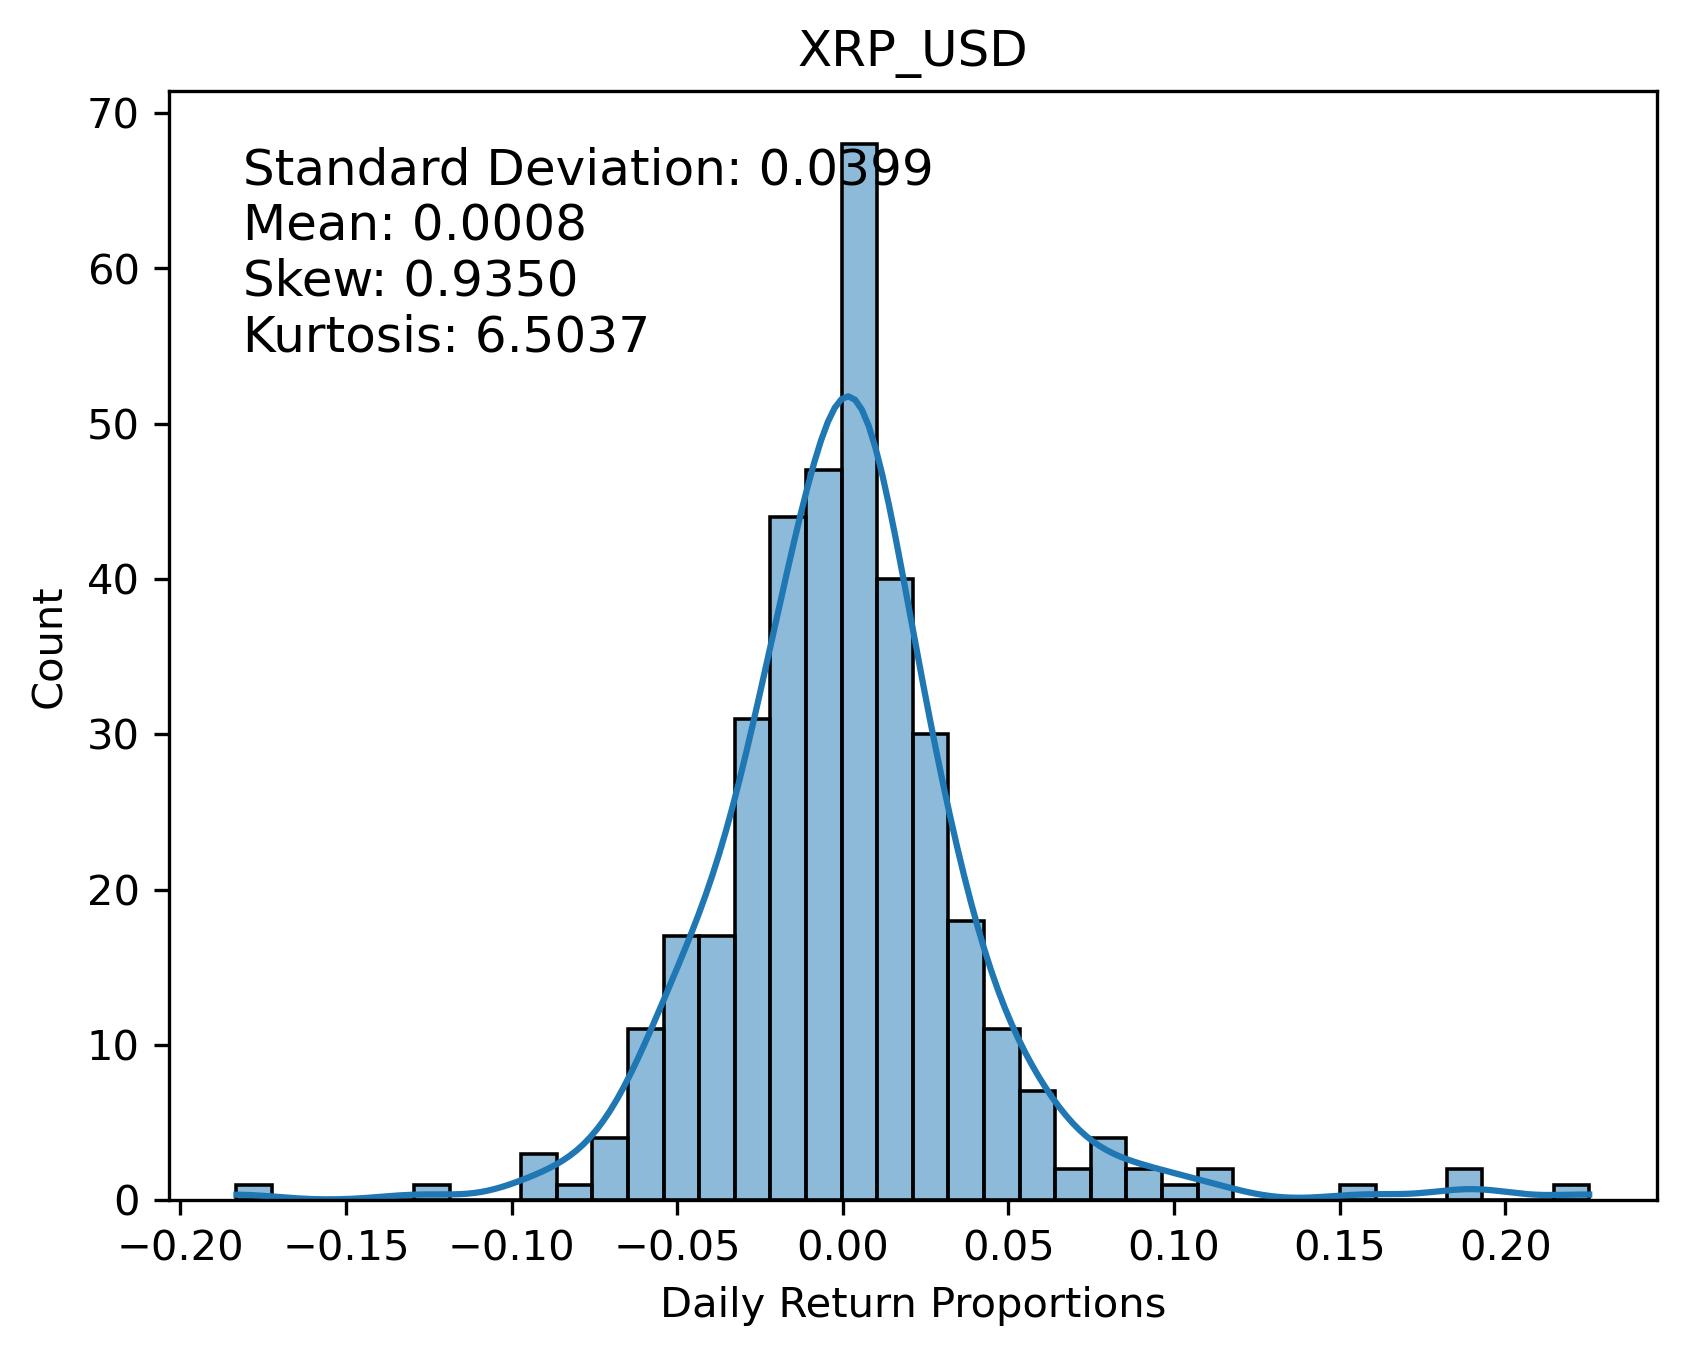
close: $0.12


pearsons cor(100-days): 0.7716
| Return Value | Short MA | Long MA | Buy Date | Sell Date | Latest Action | Sharpe Ratio | Drawdown |
|---|---|---|---|---|---|---|---|
| 155.46% | 10 | 57 | 2024-01-15 | 2024-04-13 | 1.66 | -3.73% | |
| 153.54% | 10 | 55 | 2024-01-15 | 2024-04-13 | 1.67 | -3.73% | |
| 151.23% | 13 | 53 | 2024-01-16 | 2024-04-12 | 1.84 | -1.10% | |
| 151.71% | 10 | 58 | 2024-01-15 | 2024-04-13 | 1.58 | -3.73% | |
| 150.18% | 12 | 66 | 2024-01-15 | 2024-04-15 | 1.72 | -0.82% | |
| 149.99% | 10 | 56 | 2024-01-15 | 2024-04-13 | 1.53 | -3.73% | |
| 148.23% | 10 | 54 | 2024-01-15 | 2024-04-13 | 1.55 | -3.73% |
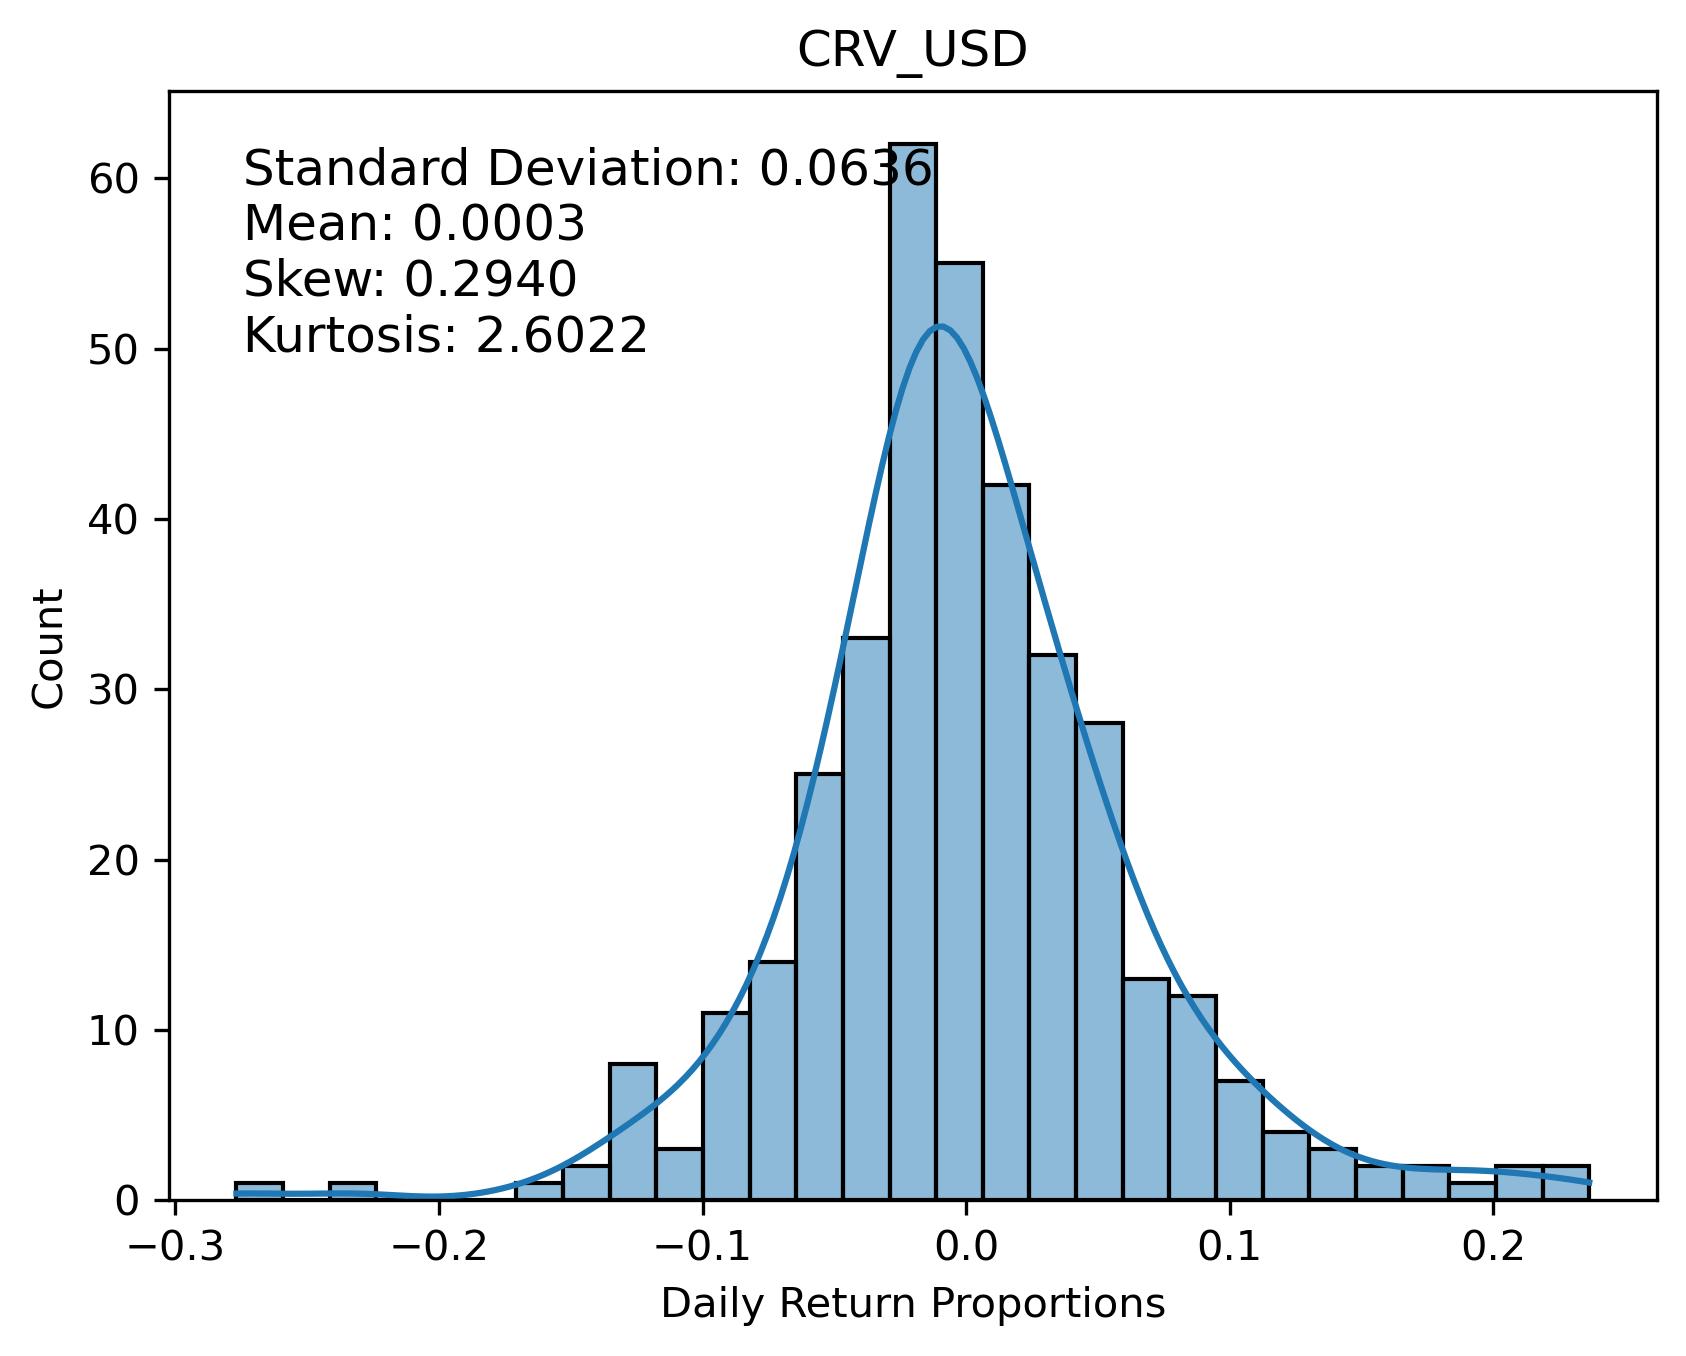
close: $0.46


pearsons cor(100-days): 0.6971
| Return Value | Short MA | Long MA | Buy Date | Sell Date | Latest Action | Sharpe Ratio | Drawdown |
|---|---|---|---|---|---|---|---|
| 254.65% | 10 | 52 | 2024-02-18 | 2024-04-04 | 1.97 | -7.25% | |
| 237.17% | 10 | 69 | 2024-02-23 | 2024-04-09 | 2.18 | -1.08% | |
| 238.76% | 10 | 51 | 2024-02-18 | 2024-04-04 | 1.86 | -7.25% | |
| 229.61% | 17 | 58 | 2024-02-23 | 2024-04-09 | 1.80 | -6.96% | |
| 229.59% | 11 | 51 | 2024-02-19 | 2024-04-04 | 1.82 | -7.25% | |
| 227.04% | 10 | 53 | 2024-02-19 | 2024-04-04 | 1.82 | -7.25% | |
| 225.73% | 18 | 57 | 2024-02-23 | 2024-04-08 | 1.77 | -4.60% |
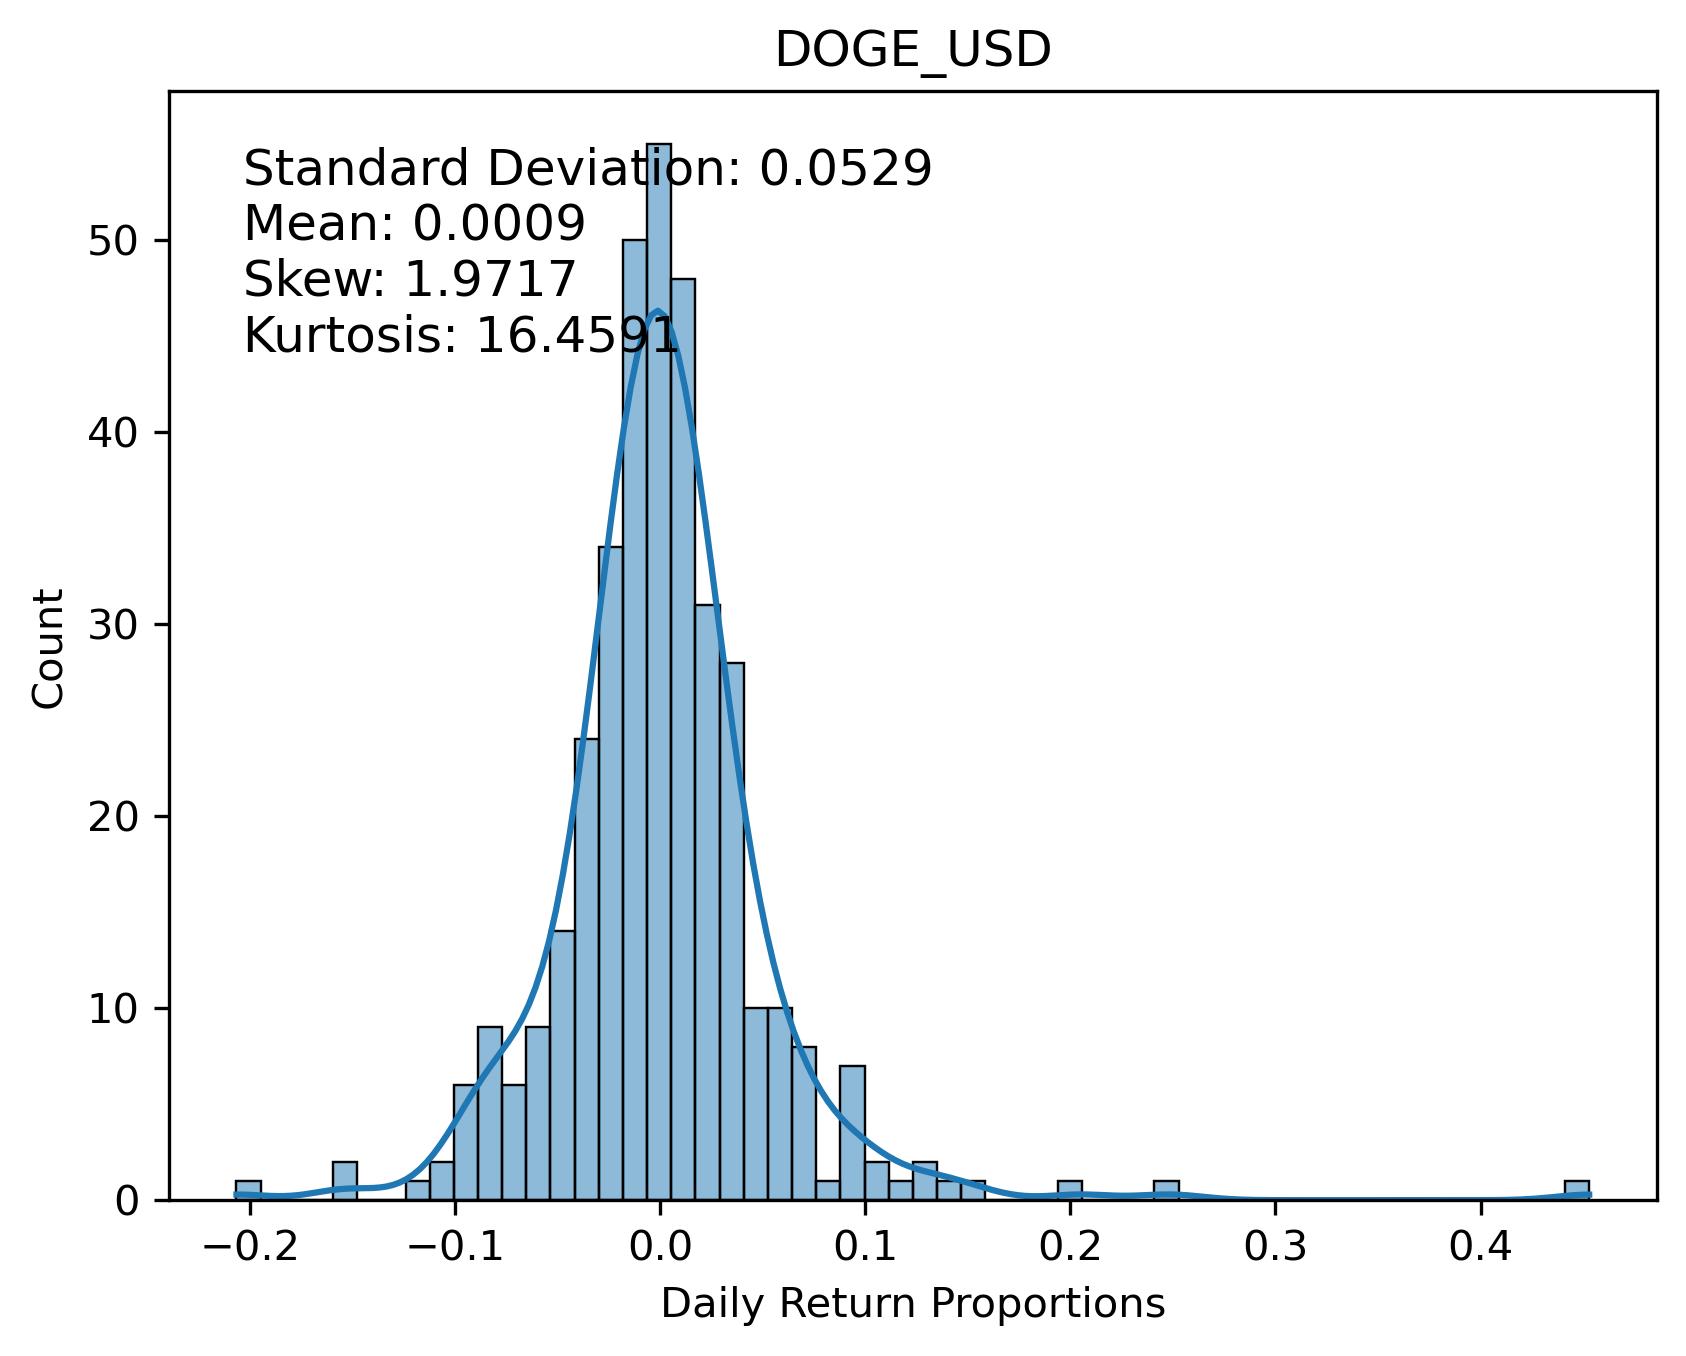
close: $0.16


pearsons cor(100-days): 0.6243
| Return Value | Short MA | Long MA | Buy Date | Sell Date | Latest Action | Sharpe Ratio | Drawdown |
|---|---|---|---|---|---|---|---|
| 285.74% | 19 | 88 | 2024-02-28 | 2024-01-18 | 1.74 | -1.39% | |
| 279.87% | 19 | 90 | 2024-02-28 | 2024-01-19 | 1.70 | -1.79% | |
| 278.36% | 20 | 88 | 2024-02-28 | 2024-01-19 | 1.69 | -1.29% | |
| 278.36% | 20 | 87 | 2024-02-28 | 2024-01-19 | 1.69 | -1.29% | |
| 276.18% | 19 | 89 | 2024-02-28 | 2024-01-19 | 1.67 | -1.39% | |
| 266.91% | 16 | 89 | 2024-02-28 | 2024-01-17 | 1.61 | -2.23% | |
| 264.68% | 20 | 89 | 2024-02-28 | 2024-01-19 | 1.58 | -4.46% |
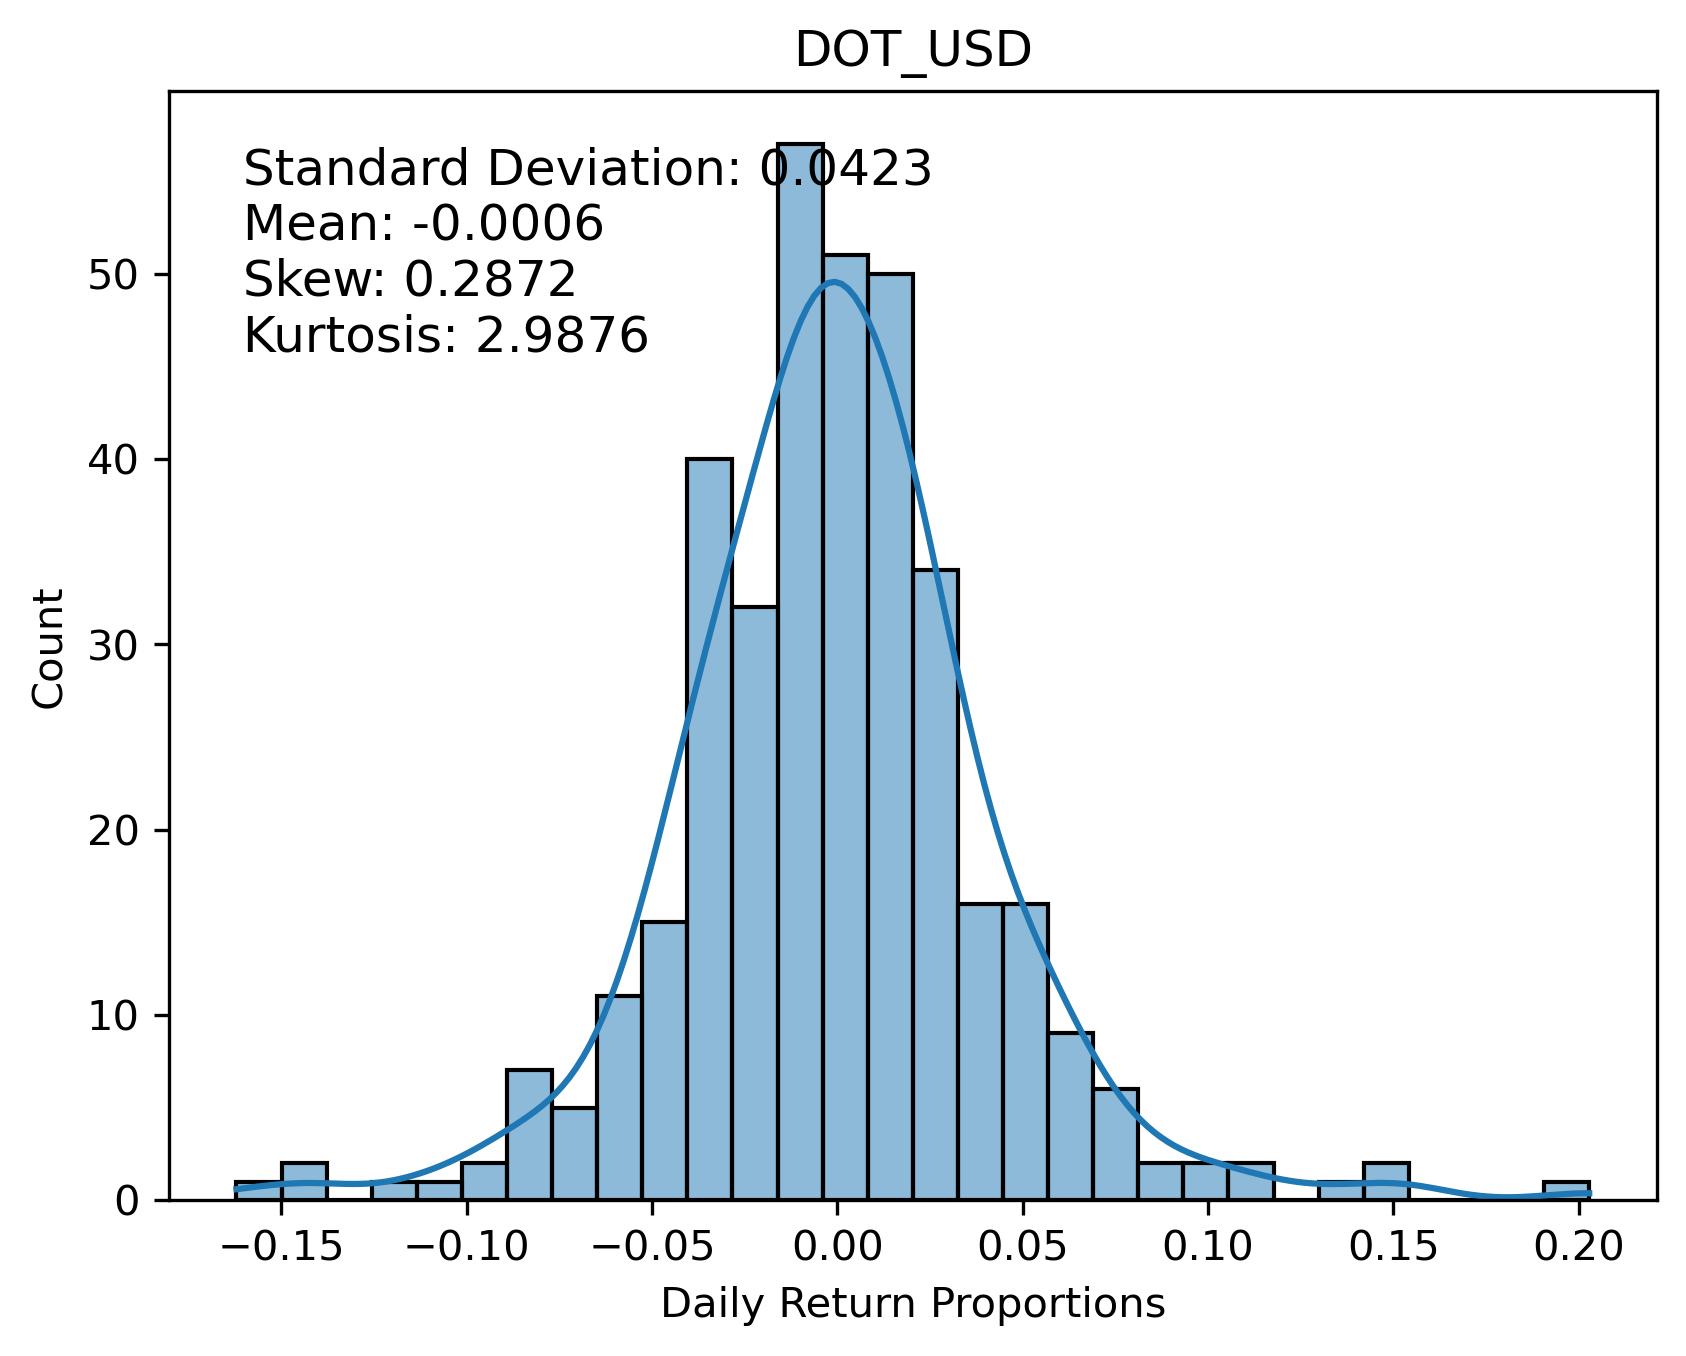
close: $7.37


pearsons cor(100-days): 0.7610
| Return Value | Short MA | Long MA | Buy Date | Sell Date | Latest Action | Sharpe Ratio | Drawdown |
|---|---|---|---|---|---|---|---|
| 176.17% | 10 | 79 | 2024-02-14 | 2024-04-12 | 1.91 | -2.62% | |
| 168.92% | 10 | 58 | 2024-02-17 | 2024-04-06 | 2.03 | -2.26% | |
| 168.92% | 10 | 59 | 2024-02-17 | 2024-04-06 | 2.03 | -2.26% | |
| 169.23% | 10 | 78 | 2024-02-14 | 2024-04-12 | 1.65 | -7.72% | |
| 167.45% | 10 | 80 | 2024-02-13 | 2024-04-12 | 1.73 | -4.42% | |
| 164.88% | 11 | 56 | 2024-02-17 | 2024-04-06 | 1.92 | -2.26% | |
| 162.15% | 11 | 74 | 2024-02-17 | 2024-04-11 | 1.81 | -4.62% |
close: $0.34


pearsons cor(100-days): 0.7563
| Return Value | Short MA | Long MA | Buy Date | Sell Date | Latest Action | Sharpe Ratio | Drawdown |
|---|---|---|---|---|---|---|---|
| 215.31% | 11 | 57 | 2024-02-19 | 2024-04-07 | 2.16 | -1.49% | |
| 208.96% | 15 | 51 | 2024-02-19 | 2024-04-06 | 1.96 | -2.03% | |
| 203.71% | 12 | 54 | 2024-02-18 | 2024-04-06 | 1.81 | -2.03% | |
| 200.98% | 12 | 55 | 2024-02-18 | 2024-04-07 | 1.79 | -1.49% | |
| 197.55% | 10 | 69 | 2024-02-19 | 2024-04-12 | 1.66 | -1.26% | |
| 196.86% | 10 | 70 | 2024-02-19 | 2024-04-12 | 1.65 | -1.26% | |
| 195.99% | 10 | 68 | 2024-02-19 | 2024-04-12 | 1.63 | -1.26% |
close: $0.84


pearsons cor(100-days): 0.7436
| Return Value | Short MA | Long MA | Buy Date | Sell Date | Latest Action | Sharpe Ratio | Drawdown |
|---|---|---|---|---|---|---|---|
| 151.81% | 12 | 52 | 2024-02-17 | 2024-04-12 | 1.80 | -1.72% | |
| 151.58% | 13 | 51 | 2024-02-17 | 2024-04-12 | 1.79 | -2.09% | |
| 150.79% | 13 | 50 | 2024-02-17 | 2024-04-12 | 1.76 | -2.09% | |
| 149.34% | 12 | 51 | 2024-02-17 | 2024-04-12 | 1.74 | -1.72% | |
| 146.75% | 12 | 50 | 2024-02-17 | 2024-04-12 | 1.59 | -3.13% | |
| 141.08% | 12 | 56 | 2024-02-19 | 2024-04-13 | 1.77 | -1.10% | |
| 140.47% | 12 | 55 | 2024-02-18 | 2024-04-13 | 1.75 | -1.10% |
close: $3.16K


pearsons cor(100-days): 0.8367
| Return Value | Short MA | Long MA | Buy Date | Sell Date | Latest Action | Sharpe Ratio | Drawdown |
|---|---|---|---|---|---|---|---|
| 151.80% | 17 | 181 | 2023-11-04 | 2023-08-19 | 1.29 | -0.38% | |
| 150.13% | 11 | 111 | 2023-10-29 | 2023-07-31 | 1.51 | -0.55% | |
| 146.11% | 13 | 70 | 2024-02-08 | 2024-04-17 | 1.58 | -3.17% | |
| 143.98% | 12 | 107 | 2023-10-29 | 2023-08-04 | 1.42 | -0.04% | |
| 143.15% | 12 | 105 | 2023-10-29 | 2023-08-05 | 1.39 | -0.20% | |
| 141.25% | 11 | 77 | 2023-10-25 | 2024-04-19 | 1.64 | -1.19% | |
| 141.25% | 11 | 76 | 2023-10-25 | 2024-04-19 | 1.64 | -1.19% |
close: $6.47


pearsons cor(100-days): 0.7851
| Return Value | Short MA | Long MA | Buy Date | Sell Date | Latest Action | Sharpe Ratio | Drawdown |
|---|---|---|---|---|---|---|---|
| 217.01% | 13 | 59 | 2024-02-19 | 2024-04-12 | 1.72 | -5.14% | |
| 213.16% | 10 | 51 | 2024-02-17 | 2024-04-07 | 1.58 | -2.82% | |
| 211.08% | 15 | 60 | 2024-02-19 | 2024-04-12 | 1.65 | -5.05% | |
| 204.56% | 15 | 51 | 2024-02-19 | 2024-04-09 | 1.39 | -6.73% | |
| 204.30% | 14 | 59 | 2024-02-19 | 2024-04-12 | 1.55 | -8.48% | |
| 200.13% | 15 | 52 | 2024-02-19 | 2024-04-09 | 1.33 | -11.52% | |
| 197.85% | 15 | 53 | 2024-02-19 | 2024-04-09 | 1.30 | -11.52% |
close: $0.73


pearsons cor(100-days): 0.5984
| Return Value | Short MA | Long MA | Buy Date | Sell Date | Latest Action | Sharpe Ratio | Drawdown |
|---|---|---|---|---|---|---|---|
| 187.47% | 12 | 53 | 2024-02-18 | 2024-04-17 | 2.02 | -2.53% | |
| 180.94% | 13 | 69 | 2024-02-24 | 2024-04-22 | sell | 2.33 | -2.71% |
| 177.49% | 14 | 52 | 2024-02-18 | 2024-04-17 | 2.27 | -3.17% | |
| 179.01% | 13 | 51 | 2024-02-18 | 2024-04-16 | 1.63 | -10.08% | |
| 174.79% | 12 | 51 | 2024-02-17 | 2024-04-16 | 1.84 | -2.53% | |
| 170.77% | 13 | 68 | 2024-02-24 | 2024-04-22 | sell | 2.21 | -0.60% |
| 172.49% | 13 | 70 | 2024-02-24 | 2024-01-21 | 1.98 | -7.21% |
close: $0.09


pearsons cor(100-days): 0.8110
| Return Value | Short MA | Long MA | Buy Date | Sell Date | Latest Action | Sharpe Ratio | Drawdown |
|---|---|---|---|---|---|---|---|
| 167.49% | 20 | 75 | 2024-02-20 | 2024-04-15 | 2.07 | 0.00% | |
| 167.22% | 20 | 74 | 2024-02-20 | 2024-04-15 | 2.07 | 0.00% | |
| 162.16% | 19 | 75 | 2024-02-20 | 2024-04-15 | 1.94 | 0.00% | |
| 159.77% | 21 | 50 | 2024-02-19 | 2024-04-03 | 1.89 | -1.29% | |
| 157.83% | 16 | 81 | 2024-02-18 | 2024-04-15 | 1.69 | -3.44% | |
| 157.83% | 17 | 80 | 2024-02-18 | 2024-04-15 | 1.69 | -3.44% | |
| 155.19% | 18 | 85 | 2024-02-18 | 2024-04-16 | 1.77 | 0.00% |
close: $2.39


pearsons cor(100-days): 0.8021
| Return Value | Short MA | Long MA | Buy Date | Sell Date | Latest Action | Sharpe Ratio | Drawdown |
|---|---|---|---|---|---|---|---|
| 180.29% | 16 | 69 | 2024-02-07 | 2024-04-04 | 2.12 | 0.00% | |
| 172.80% | 17 | 65 | 2024-02-09 | 2024-03-31 | 2.13 | -0.48% | |
| 169.65% | 15 | 90 | 2023-10-30 | 2024-04-12 | 1.75 | -0.21% | |
| 169.22% | 20 | 111 | 2023-11-04 | 2024-04-16 | 1.44 | 0.00% | |
| 163.46% | 11 | 50 | 2024-02-07 | 2024-03-22 | 2.07 | -6.97% | |
| 159.04% | 19 | 81 | 2023-10-30 | 2024-04-12 | 1.62 | -0.21% | |
| 155.38% | 13 | 60 | 2024-02-08 | 2024-03-26 | 2.21 | 0.00% |
close: $32.81


pearsons cor(100-days): 0.6411

| Return Value | Short MA | Long MA | Buy Date | Sell Date | Latest Action | Sharpe Ratio | Drawdown |
|---|---|---|---|---|---|---|---|
| 159.86% | 20 | 69 | 2024-02-12 | 2024-04-04 | 1.77 | -3.02% | |
| 150.84% | 21 | 69 | 2024-02-13 | 2024-04-04 | 1.62 | -2.62% | |
| 147.11% | 20 | 71 | 2023-11-01 | 2024-04-04 | 1.57 | 0.00% | |
| 147.11% | 19 | 71 | 2023-11-01 | 2024-04-04 | 1.57 | 0.00% | |
| 148.77% | 14 | 83 | 2023-11-01 | 2024-04-08 | 1.54 | -4.58% | |
| 146.94% | 10 | 175 | 2023-11-05 | 2024-04-15 | 1.44 | -2.20% | |
| 146.94% | 10 | 174 | 2023-11-05 | 2024-04-15 | 1.44 | -2.20% |
close: $15.36


pearsons cor(100-days): 0.6799
| Return Value | Short MA | Long MA | Buy Date | Sell Date | Latest Action | Sharpe Ratio | Drawdown |
|---|---|---|---|---|---|---|---|
| 196.76% | 21 | 107 | 2023-09-27 | 2024-04-15 | 1.96 | -2.86% | |
| 175.30% | 18 | 76 | 2024-01-27 | 2024-04-04 | 2.15 | -1.92% | |
| 174.99% | 14 | 80 | 2024-01-31 | 2024-04-08 | 2.14 | -1.93% | |
| 177.08% | 13 | 57 | 2024-01-31 | 2024-03-23 | 2.19 | -8.34% | |
| 174.28% | 16 | 65 | 2024-01-31 | 2024-03-29 | 2.11 | -4.35% | |
| 172.63% | 17 | 76 | 2024-01-26 | 2024-04-06 | 1.98 | -5.52% | |
| 173.48% | 13 | 55 | 2024-01-31 | 2024-03-23 | 1.98 | -8.74% |
close: $84.48


pearsons cor(100-days): 0.6345
| Return Value | Short MA | Long MA | Buy Date | Sell Date | Latest Action | Sharpe Ratio | Drawdown |
|---|---|---|---|---|---|---|---|
| 201.54% | 12 | 71 | 2024-02-26 | 2024-04-20 | 2.21 | -3.67% | |
| 197.93% | 13 | 67 | 2024-02-17 | 2024-04-21 | 2.36 | -1.39% | |
| 198.01% | 13 | 66 | 2024-02-17 | 2024-04-20 | 2.32 | -3.67% | |
| 197.63% | 12 | 69 | 2024-02-26 | 2024-04-20 | 2.20 | -3.67% | |
| 194.62% | 12 | 78 | 2024-02-26 | 2024-04-22 | sell | 2.33 | -0.97% |
| 184.66% | 13 | 68 | 2024-02-17 | 2024-04-21 | 2.21 | -1.39% | |
| 185.14% | 13 | 64 | 2024-02-16 | 2024-04-20 | 2.11 | -3.67% |
close: $0.48


pearsons cor(100-days): 0.7445
| Return Value | Short MA | Long MA | Buy Date | Sell Date | Latest Action | Sharpe Ratio | Drawdown |
|---|---|---|---|---|---|---|---|
| 182.60% | 15 | 59 | 2024-02-19 | 2024-04-12 | 1.93 | -0.75% | |
| 181.49% | 14 | 61 | 2024-02-19 | 2024-04-12 | 1.91 | -0.75% | |
| 180.24% | 18 | 54 | 2024-02-19 | 2024-04-12 | 1.80 | -0.25% | |
| 179.36% | 20 | 54 | 2024-02-19 | 2024-04-12 | 1.70 | -3.00% | |
| 178.13% | 18 | 55 | 2024-02-19 | 2024-04-12 | 1.76 | -0.34% | |
| 174.92% | 14 | 65 | 2024-02-19 | 2024-04-12 | 1.83 | -2.25% | |
| 173.72% | 15 | 60 | 2024-02-19 | 2024-04-12 | 1.85 | 0.00% |
close: $0.73


pearsons cor(100-days): 0.7212

| Return Value | Short MA | Long MA | Buy Date | Sell Date | Latest Action | Sharpe Ratio | Drawdown |
|---|---|---|---|---|---|---|---|
| 195.13% | 10 | 57 | 2024-02-15 | 2024-03-31 | 2.19 | -5.70% | |
| 189.32% | 21 | 65 | 2024-02-18 | 2024-04-05 | 1.67 | -2.45% | |
| 178.19% | 11 | 69 | 2024-02-15 | 2024-04-04 | 1.46 | -5.30% | |
| 172.29% | 12 | 69 | 2024-02-16 | 2024-04-04 | 1.37 | -5.30% | |
| 171.24% | 12 | 58 | 2024-02-16 | 2024-04-01 | 2.04 | -5.91% | |
| 171.26% | 12 | 53 | 2024-02-16 | 2024-03-28 | 1.82 | -6.16% | |
| 168.46% | 12 | 60 | 2024-02-15 | 2024-04-02 | 2.10 | -4.00% |
close: $0.87


pearsons cor(100-days): 0.3881
| Return Value | Short MA | Long MA | Buy Date | Sell Date | Latest Action | Sharpe Ratio | Drawdown |
|---|---|---|---|---|---|---|---|
| 273.56% | 19 | 81 | 2023-10-23 | 2024-03-31 | 1.22 | 0.00% | |
| 258.87% | 20 | 78 | 2023-10-23 | 2024-04-01 | 1.13 | 0.00% | |
| 251.94% | 10 | 116 | 2023-10-23 | 2024-04-03 | 1.06 | -0.16% | |
| 246.43% | 10 | 115 | 2023-10-23 | 2024-04-02 | 1.04 | 0.00% | |
| 244.61% | 11 | 103 | 2023-10-23 | 2024-03-26 | 1.03 | 0.00% | |
| 240.90% | 17 | 75 | 2023-10-23 | 2024-03-29 | 1.03 | -0.35% | |
| 239.86% | 20 | 79 | 2023-10-23 | 2024-04-01 | 1.01 | 0.00% |
close: $6.92


pearsons cor(100-days): 0.6199
| Return Value | Short MA | Long MA | Buy Date | Sell Date | Latest Action | Sharpe Ratio | Drawdown |
|---|---|---|---|---|---|---|---|
| 163.54% | 19 | 80 | 2024-02-12 | 2024-02-06 | 1.51 | -5.92% | |
| 161.11% | 18 | 80 | 2024-02-12 | 2024-02-06 | 1.41 | -8.95% | |
| 156.93% | 20 | 76 | 2024-02-21 | 2024-02-05 | 1.68 | -0.12% | |
| 156.51% | 16 | 80 | 2024-02-10 | 2024-02-05 | 1.58 | -2.94% | |
| 155.56% | 11 | 118 | 2023-11-01 | 2023-04-25 | 1.73 | -4.50% | |
| 155.56% | 11 | 117 | 2023-11-01 | 2023-04-25 | 1.73 | -4.50% | |
| 153.15% | 11 | 125 | 2023-11-02 | 2023-04-26 | 2.02 | -0.66% |
close: $2.48


pearsons cor(100-days): 0.5268
| Return Value | Short MA | Long MA | Buy Date | Sell Date | Latest Action | Sharpe Ratio | Drawdown |
|---|---|---|---|---|---|---|---|
| 203.33% | 12 | 99 | 2024-03-30 | 2024-04-02 | 1.71 | -2.88% | |
| 195.38% | 11 | 99 | 2024-03-29 | 2024-04-03 | 1.59 | -3.85% | |
| 194.61% | 17 | 98 | 2023-11-06 | 2024-03-31 | 1.73 | -2.93% | |
| 184.60% | 10 | 58 | 2024-02-10 | 2024-03-22 | 2.64 | -7.30% | |
| 184.30% | 10 | 70 | 2024-03-29 | 2024-04-01 | 2.21 | -6.04% | |
| 184.91% | 14 | 99 | 2023-11-05 | 2024-03-28 | 1.46 | -8.31% | |
| 184.02% | 17 | 63 | 2024-02-10 | 2024-03-28 | 1.74 | -7.36% |
close: $1.01


pearsons cor(100-days): -0.0688
| Return Value | Short MA | Long MA | Buy Date | Sell Date | Latest Action | Sharpe Ratio | Drawdown |
|---|---|---|---|---|---|---|---|
| 160.38% | 17 | 50 | 2024-03-06 | 2024-03-16 | 1.94 | -1.02% | |
| 155.92% | 16 | 50 | 2024-03-06 | 2024-03-16 | 1.81 | -1.96% | |
| 150.09% | 14 | 51 | 2024-03-06 | 2024-03-16 | 1.93 | -1.08% | |
| 150.09% | 15 | 50 | 2024-03-06 | 2024-03-16 | 1.93 | -1.08% | |
| 148.47% | 16 | 65 | 2024-03-12 | 2024-03-16 | 1.80 | -0.27% | |
| 148.40% | 19 | 50 | 2024-03-06 | 2024-03-16 | 1.79 | -0.13% | |
| 147.20% | 15 | 65 | 2024-03-11 | 2024-03-16 | 1.77 | -0.09% |
close: $0.00


pearsons cor(100-days):
| Return Value | Short MA | Long MA | Buy Date | Sell Date | Latest Action | Sharpe Ratio | Drawdown |
|---|---|---|---|---|---|---|---|
| 181.50% | 14 | 54 | 2023-07-22 | 2023-08-03 | 2.30 | -4.40% | |
| 160.20% | 14 | 53 | 2023-07-21 | 2023-08-03 | 1.72 | -4.40% | |
| 155.38% | 10 | 153 | 2023-03-19 | 2023-05-05 | 1.60 | -1.22% | |
| 155.80% | 11 | 68 | 2023-07-23 | 2023-07-24 | 1.61 | -3.68% | |
| 155.80% | 11 | 69 | 2023-07-23 | 2023-07-24 | 1.61 | -3.68% | |
| 150.48% | 11 | 158 | 2023-03-19 | 2023-05-06 | 1.51 | 0.00% | |
| 149.35% | 12 | 68 | 2023-03-19 | 2023-04-24 | 1.48 | 0.00% |
close: $5.54


pearsons cor(100-days): 0.6954

| Return Value | Short MA | Long MA | Buy Date | Sell Date | Latest Action | Sharpe Ratio | Drawdown |
|---|---|---|---|---|---|---|---|
| 245.01% | 14 | 50 | 2024-02-13 | 2024-04-12 | 2.06 | -2.56% | |
| 231.35% | 14 | 52 | 2024-02-13 | 2024-04-12 | 1.96 | -0.51% | |
| 220.32% | 12 | 54 | 2024-02-13 | 2024-04-12 | 1.82 | -5.97% | |
| 209.70% | 15 | 50 | 2024-02-13 | 2024-04-12 | 1.89 | -0.77% | |
| 205.77% | 12 | 55 | 2024-02-14 | 2024-04-12 | 1.84 | -3.84% | |
| 199.94% | 13 | 54 | 2024-02-14 | 2024-04-12 | 1.75 | -4.33% | |
| 199.98% | 11 | 55 | 2024-02-13 | 2024-04-12 | 1.72 | -5.49% |
close: $0.48


pearsons cor(100-days): 0.7204
| Return Value | Short MA | Long MA | Buy Date | Sell Date | Latest Action | Sharpe Ratio | Drawdown |
|---|---|---|---|---|---|---|---|
| 240.05% | 10 | 67 | 2024-02-23 | 2024-04-12 | 2.13 | -7.28% | |
| 238.73% | 10 | 65 | 2024-02-23 | 2024-04-12 | 2.12 | -7.28% | |
| 233.19% | 10 | 66 | 2024-02-23 | 2024-04-12 | 2.05 | -7.28% | |
| 209.17% | 10 | 68 | 2024-02-23 | 2024-04-12 | 1.75 | -7.28% | |
| 204.98% | 11 | 64 | 2024-02-23 | 2024-04-12 | 1.97 | -0.95% | |
| 198.85% | 11 | 65 | 2024-02-24 | 2024-04-12 | 1.89 | -0.95% | |
| 195.28% | 11 | 66 | 2024-02-24 | 2024-04-12 | 1.83 | -0.95% |
close: $0.00


pearsons cor(100-days): 0.6568
| Return Value | Short MA | Long MA | Buy Date | Sell Date | Latest Action | Sharpe Ratio | Drawdown |
|---|---|---|---|---|---|---|---|
| 182.77% | 13 | 96 | 2024-02-17 | 2024-01-27 | 1.28 | -4.85% | |
| 170.87% | 11 | 96 | 2024-02-16 | 2024-01-26 | 1.16 | -3.30% | |
| 169.48% | 17 | 96 | 2024-02-21 | 2024-01-30 | 1.21 | -2.23% | |
| 167.85% | 10 | 96 | 2024-02-15 | 2024-01-26 | 1.13 | -2.24% | |
| 167.98% | 11 | 122 | 2023-11-04 | 2023-08-26 | 2.02 | -4.38% | |
| 162.71% | 21 | 75 | 2024-02-28 | 2024-01-24 | 1.47 | -0.20% | |
| 159.43% | 10 | 73 | 2024-02-26 | 2024-02-22 | 2.03 | -2.39% |
close: $153.79


pearsons cor(100-days): 0.6347
| Return Value | Short MA | Long MA | Buy Date | Sell Date | Latest Action | Sharpe Ratio | Drawdown |
|---|---|---|---|---|---|---|---|
| 233.05% | 13 | 54 | 2024-02-04 | 2024-04-17 | 1.57 | -3.08% | |
| 227.68% | 11 | 54 | 2024-02-01 | 2024-04-17 | 1.52 | -3.08% | |
| 227.59% | 12 | 53 | 2024-02-03 | 2024-04-17 | 1.51 | -5.34% | |
| 217.53% | 12 | 55 | 2024-02-01 | 2024-04-17 | 1.46 | -3.08% | |
| 216.18% | 13 | 52 | 2024-02-06 | 2024-04-17 | 1.41 | -3.73% | |
| 216.20% | 14 | 51 | 2024-02-08 | 2024-04-17 | 1.39 | -9.22% | |
| 215.07% | 13 | 51 | 2024-02-07 | 2024-04-16 | 1.38 | -7.65% |
close: $2.35


pearsons cor(100-days): 0.7174
| Return Value | Short MA | Long MA | Buy Date | Sell Date | Latest Action | Sharpe Ratio | Drawdown |
|---|---|---|---|---|---|---|---|
| 172.57% | 19 | 68 | 2024-02-23 | 2024-04-22 | sell | 2.20 | -2.17% |
| 172.43% | 19 | 69 | 2024-02-23 | 2024-01-21 | 2.22 | -2.17% | |
| 169.98% | 10 | 87 | 2024-02-17 | 2024-01-22 | 1.81 | -3.05% | |
| 162.96% | 19 | 70 | 2024-02-23 | 2024-01-21 | 1.96 | -2.17% | |
| 160.59% | 12 | 83 | 2024-02-18 | 2024-01-22 | 1.73 | -6.03% | |
| 159.99% | 15 | 54 | 2024-02-19 | 2024-04-15 | 2.05 | -5.28% | |
| 153.74% | 13 | 89 | 2024-02-19 | 2024-01-24 | 2.08 | -1.44% |
close: $8.06


pearsons cor(100-days): 0.7840
| Return Value | Short MA | Long MA | Buy Date | Sell Date | Latest Action | Sharpe Ratio | Drawdown |
|---|---|---|---|---|---|---|---|
| 176.83% | 14 | 57 | 2024-02-15 | 2024-04-10 | 2.22 | -0.42% | |
| 173.74% | 14 | 64 | 2024-02-15 | 2024-04-12 | 2.14 | -0.42% | |
| 174.07% | 15 | 55 | 2024-02-16 | 2024-04-10 | 2.03 | -2.00% | |
| 173.24% | 12 | 118 | 2023-11-11 | 2024-04-17 | 1.68 | -6.65% | |
| 168.83% | 15 | 60 | 2024-02-15 | 2024-04-12 | 1.99 | -0.28% | |
| 168.73% | 13 | 64 | 2024-02-14 | 2024-04-12 | 2.00 | -0.42% | |
| 168.20% | 13 | 63 | 2024-02-14 | 2024-04-12 | 2.05 | -2.00% |
close: $0.12


pearsons cor(100-days): 0.6553
| Return Value | Short MA | Long MA | Buy Date | Sell Date | Latest Action | Sharpe Ratio | Drawdown |
|---|---|---|---|---|---|---|---|
| 157.83% | 19 | 53 | 2024-02-26 | 2024-04-12 | 1.75 | -3.10% | |
| 156.01% | 12 | 88 | 2024-03-01 | 2024-04-15 | 2.09 | -1.35% | |
| 154.77% | 19 | 64 | 2024-03-01 | 2024-04-15 | 1.96 | -2.76% | |
| 154.11% | 12 | 86 | 2024-03-01 | 2024-04-15 | 2.07 | -1.35% | |
| 154.13% | 11 | 87 | 2024-03-01 | 2024-04-15 | 2.01 | -3.96% | |
| 151.69% | 12 | 117 | 2024-03-01 | 2024-04-15 | 2.04 | -0.47% | |
| 152.71% | 11 | 88 | 2024-03-01 | 2024-04-15 | 1.95 | -3.96% |
close: $0.55


pearsons cor(100-days): 0.6606
| Return Value | Short MA | Long MA | Buy Date | Sell Date | Latest Action | Sharpe Ratio | Drawdown |
|---|---|---|---|---|---|---|---|
| 306.38% | 16 | 56 | 2024-02-26 | 2024-04-11 | 1.49 | -7.13% | |
| 298.00% | 14 | 92 | 2024-03-04 | 2024-04-15 | 1.51 | -1.20% | |
| 290.54% | 16 | 57 | 2024-02-26 | 2024-04-11 | 1.40 | -7.94% | |
| 283.12% | 14 | 70 | 2024-03-01 | 2024-04-13 | 1.45 | -1.56% | |
| 283.60% | 16 | 55 | 2024-02-25 | 2024-04-10 | 1.36 | -5.28% | |
| 280.70% | 14 | 62 | 2024-02-27 | 2024-04-12 | 1.44 | -0.76% | |
| 274.05% | 20 | 61 | 2024-02-29 | 2024-04-13 | 1.35 | -1.79% |